Bitcoin Is Range Bound between $60,000 and $63,000 as Bulls and Bears Reach Indecision
Updated: Nov 01, 2021 at 10:21

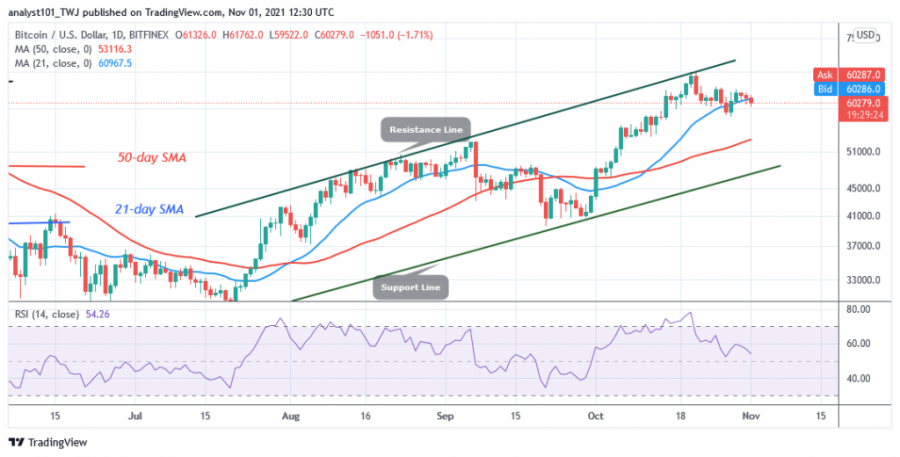
Last week, Bitcoin (BTC) price fluctuated above the psychological price level of $60,000. Today, the cryptocurrency is trading at $60,626 and fluctuating between $60,000 and $63,000.
Bitcoin's upward movement is hampered by the bulls' failure to keep prices above the $63,000 and $64,000 highs.
Breaking through the resistance levels will cause Bitcoin to resume its upward momentum. However, with buyers failing to keep the price above the recent high, Bitcoin was forced to move within a range between $60,000 and $63,000. The upside or downside will be decided when the rangebound levels are broken. In the meantime, the price of BTC will continue to fluctuate for a few more days.
Bitcoin indicator reading
The cryptocurrency is at level 57 of the Relative Strength Index of period 14, which means that Bitcoin is in the bullish trend zone and above the midline 50. There is a possibility of further upward movement. The 21-day moving average line serves as a support level. The BTC price has found support above the moving average for further upside. The cryptocurrency price is above the 25% area of the daily stochastic. This indicates that the market is in a bullish momentum.

Technical indicators:
Major Resistance Levels - $65,000 and $70,000
Major Support Levels - $60,000 and $55,000
What is the next direction for BTC/USD?
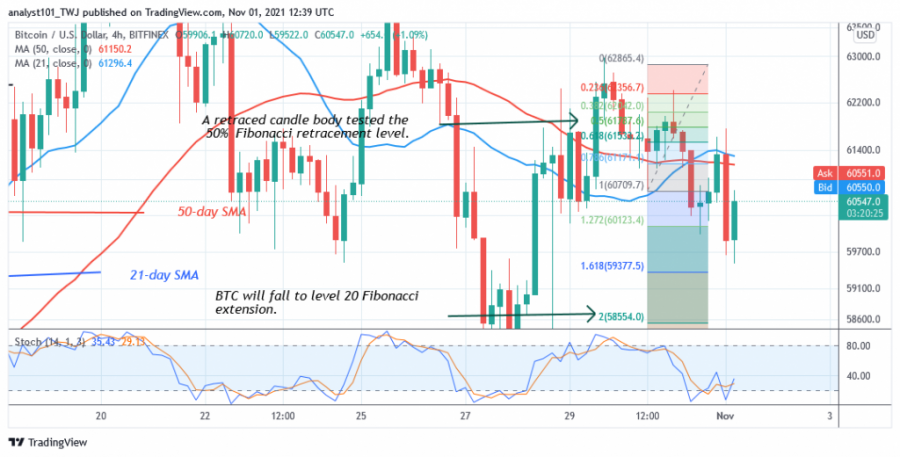
On the 4-hour chart, Bitcoin is in a downtrend as the price is falling below the moving averages. Meanwhile, the downtrend from October 30 has shown a candle body testing the 50% Fibonacci retracement level. The retracement suggests that BTC is likely to fall to the 2.0 Fibonacci extension level or $58,554.00.

Disclaimer. This analysis and forecast are the personal opinions of the author and are not a recommendation to buy or sell cryptocurrency and should not be viewed as an endorsement by CoinIdol. Readers should do their own research before investing funds.
News
News
Price
Coin expert
Price

(0 comments)