Bitcoin Hovers above $58,600 Support as Price Deepens in the Oversold Region

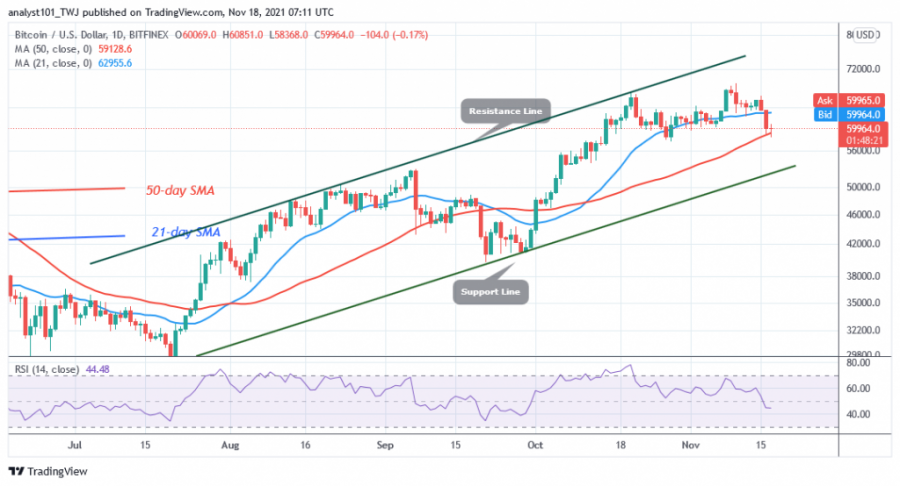
Bitcoin (BTC) is in a downtrend as the price breaks below the 21-day moving average and Bitcoin dips to a low of $58,625. In addition, the BTC price has fallen above the 50-day moving average.
Today, buyers are defending the moving average of the 50-day line, which is an important support. The BTC price is moving above the crucial support.
If the bears break the 50-day moving average line and the bearish momentum continues, the market will fall to a low of $57,800. On the other hand, if the support of the 50-day moving average line holds, the BTC price will rise and break the 21-day moving average line. This will drive the BTC price higher and retest the resistance zone between $67,000 and $68,000. However, if the two moving averages remain unbroken, Bitcoin will be forced to move in the middle of the moving averages.
Bitcoin indicator reading
The bitcoin price bar is in the middle of the moving averages. That is, it is above the 50-day moving average and below the 21-day moving average. If the price falls below the moving average of the 50-day line, Bitcoin will continue to fall. If the price breaks above the 21-day moving average line, the BTC price will also rise. Bitcoin is in a range if these levels remain unbroken. Bitcoin has fallen below the 20% range on the daily Stochastic. Selling pressure has reached bearish exhaustion.

Technical indicators:
Major Resistance Levels - $65,000 and $70,000
Major Support Levels - $60,000 and $55,000
What is the next direction for BTC?
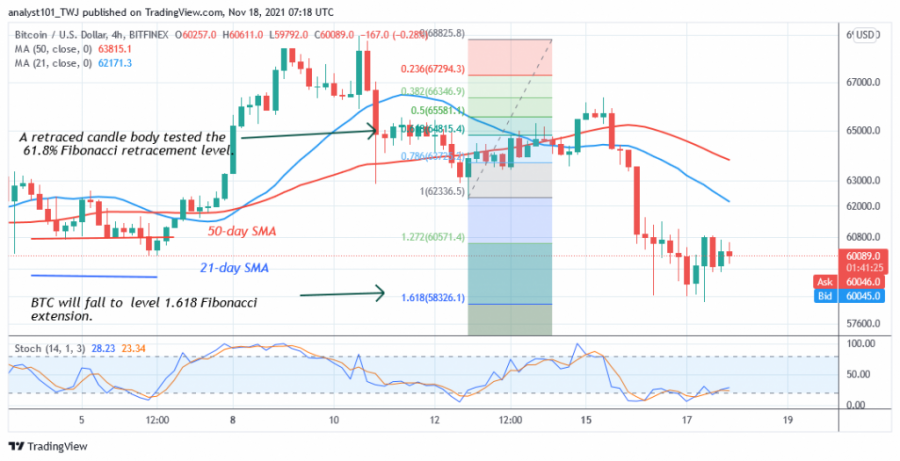
On the 4-hour chart, the price of BTC is in a downtrend. The downtrend seems to be reaching bearish exhaustion. Meanwhile, the downtrend tested the 61.8% Fibonacci retracement level on November 10 through a retreating candlestick. The retracement suggests that the BTC price will fall to the Fibonacci extension level of 1.618 or $58,326.10.

Disclaimer. This analysis and forecast are the personal opinions of the author and are not a recommendation to buy or sell cryptocurrency and should not be viewed as an endorsement by CoinIdol. Readers should do their own research before investing funds.
Price
Price
Price
Price
Price

(0 comments)