TRON Continues Its Upward Trend Above $0.127
Updated: Jul 06, 2024 at 14:02

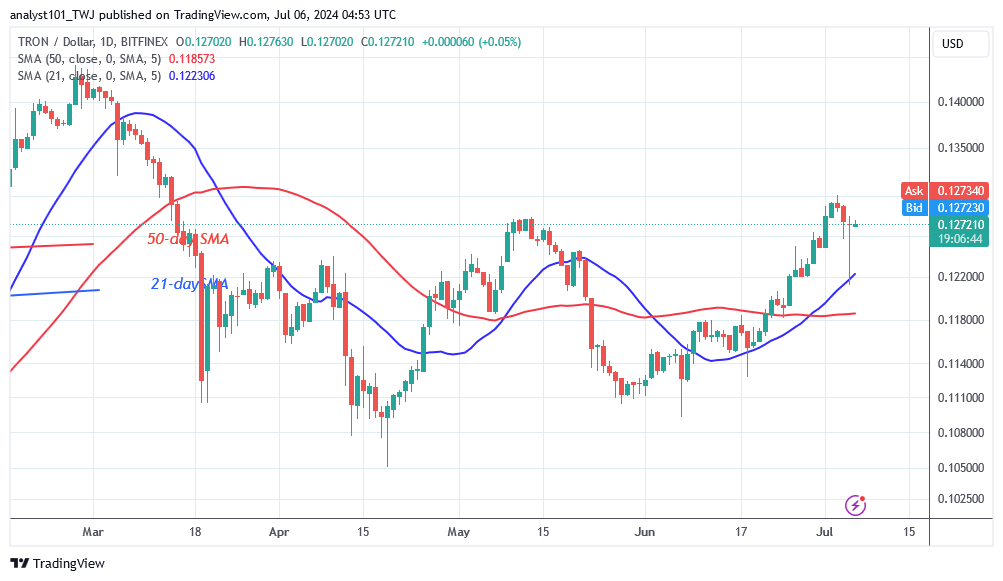
The latest price analysis by Coinidol.com report, the price of TRON (TRX) rose to a high of $0.13 on July 3.
TRON price long term forecast: bullish
The uptrend has slowed down as it reaches resistance at $0.13. The altcoin encountered harsh rejection at its recent high but quickly fell above the 21-day SMA. The bulls bought the dips as the altcoin started a new uptrend. Should the bulls break the barrier at $0.13, the market will rally to a high of $0.135. However, if the buyers fail to sustain the price above the current resistance of $0.13, the altcoin will be forced to trade sideways below its previous high. The market will fluctuate below the $0.13 resistance while remaining above the moving average lines. TRON is now worth $0.127.
TRON indicator reading
TRON price bars remain above the moving average lines despite the recent dip. The altcoin has fallen sharply, with a long candlestick tail pointing to the 21-day SMA or resistance at $0.123. The long candlestick tail indicates strong buying above the 21-day SMA support.

Technical indicators
Key supply zones: $0.13, $0.14, $0.15
Key demand zones: $0.10, $0.09, $0.08
What's the next move for TRON?
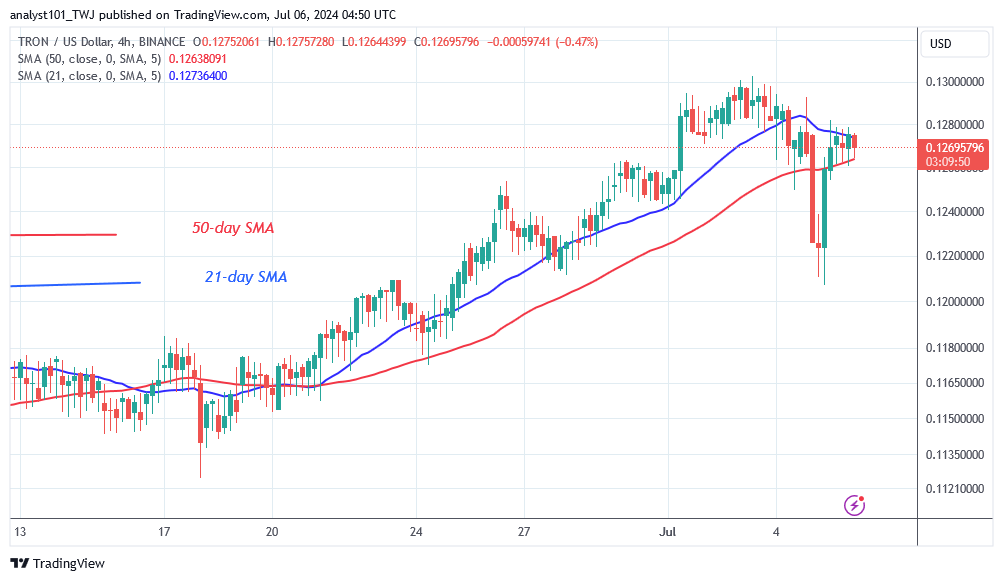
On the 4-hour chart, TRON is in decline below the moving average lines. The altcoin has not yet fully recovered from the recent decline, but it has risen above the moving average lines. A break above $0.13 will push the altcoin into an uptrend, otherwise it will continue its sideways trend.

Disclaimer. This analysis and forecast are the personal opinions of the author and are not a recommendation to buy or sell cryptocurrency and should not be viewed as an endorsement by CoinIdol.com. Readers should do their research before investing in funds.
News
Price
News
Price
Price

(0 comments)