Bitcoin Bulls Recoup Above $55,000 Support after Rejection at the $58,000 High

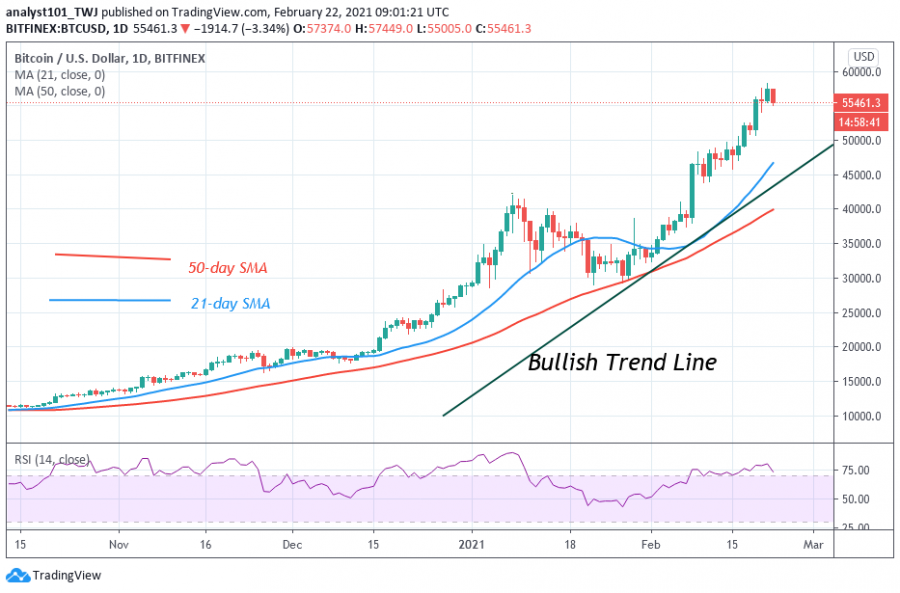
Over the past 48 hours, Bitcoin’s price has been fluctuating between $55,000 and $58,000. Buyers could not reach the $60,000 psychological price level as the uptrend was interrupted at the recent high.
Later, BTC’s price slumped to a $55,000 low then corrected upward. In the previous price action, BTC price rebounded above the $51,000 support as price rallied to a $56,000 high. The cryptocurrency corrected for two days before it rallied to a $58,000 high.
Bitcoin has fallen to the previous price level that was earlier broken. Nonetheless, if the bullish momentum resumes and price breaks the $58,000 high, a rally to $60,000 is expected. However, if the bears decide to break the $55,000 support, the Bitcoin price will resume a downward move. Presently, Bitcoin is falling as it approaches the previous low at $54,000. The downtrend will continue if price breaks below the $54,000 support.
Bitcoin indicator reading
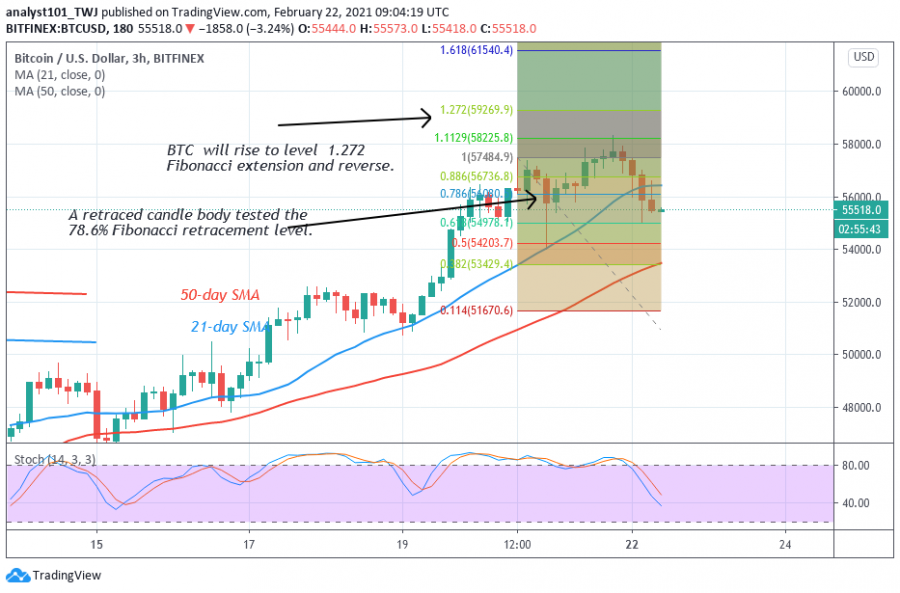
Bitcoin price is above the 80% range of the daily Stochastic. BTC price has also fallen to level 80 of the Relative Strength Index period 14. Both indicators are showing an overbought region of the markets. We expect sellers to emerge in the overbought region of the market.

Technical indicators:
Major Resistance Levels – $60,000 and $62,000
Major Support Levels – $50,000 and $48,000
What is the next direction for BTC/USD?
The cryptocurrency is currently retracing to the previous support. The upside momentum will resume if price finds support at either the $54,000 or $55,000 support levels. Meanwhile, on February 20 uptrend; a retraced candle body tested the 78.6 % Fibonacci retracement level. The retracement indicates that BTC will rise to level 1.272 Fibonacci extension and reverse. That is a high of level $59,269.90.30. Presently, the market is rising to this level.

Disclaimer. This analysis and forecast are the personal opinions of the author and not a recommendation to buy or sell cryptocurrency and should not be viewed as an endorsement by CoinIdol. Readers should do their own research before investing funds.
Price
Price
Price
Price
Price

(0 comments)