Bitcoin Holds above $47,000 Support as Bulls Show Signs of Positive Moves
Updated: Dec 09, 2021 at 11:52

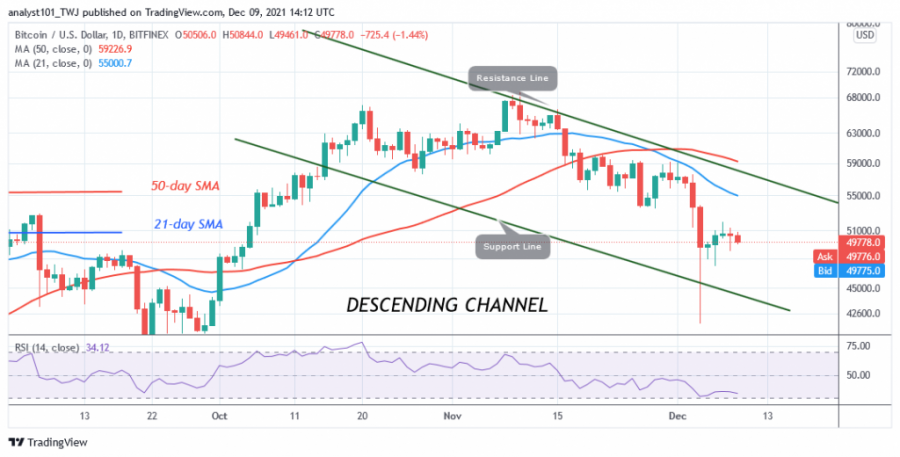
Bitcoin (BTC) is trading marginally above $47,000 support after the December 4 plunge. Today, BTC is easing back to find support above the $49,000 level.
Yesterday, the cryptocurrency was in an uptrend, reaching a high of $51,970 before being knocked back at the $52,000 resistance zone.
Last week, the bitcoin price fluctuated between $47,000 and $52,000. If buyers push the BTC price above the $52,000 high and the bullish momentum continues, bitcoin will rally and retest the $60,000 psychological price level. However, it will be difficult for the bears to drop below the $47,000 support as Bitcoin is under heavy buying pressure. The long candlestick suggests that support levels around the $42,000 low will provide strong buying pressure. Meanwhile, Bitcoin will continue to move within the trading range if buyers fail to break the recent high.
Bitcoin indicator reading
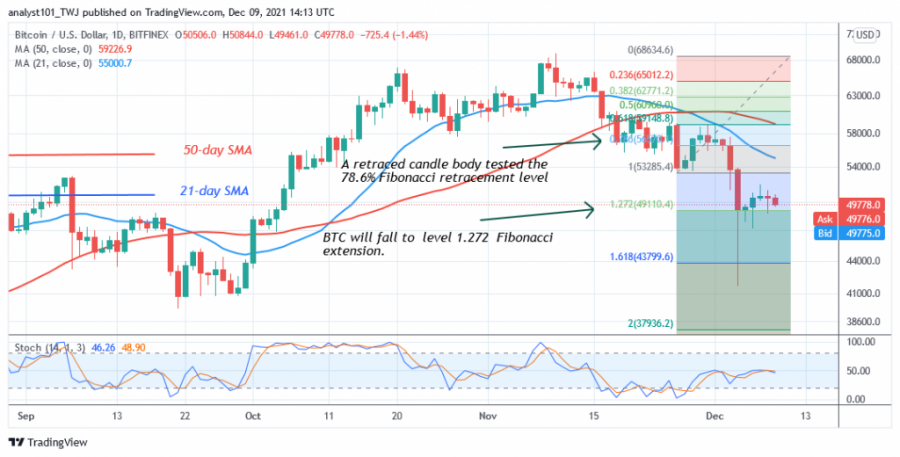
Bitcoin is at level 33 on the Relative Strength Index for period 14. The market is still in the downtrend, which will cause Bitcoin to decline. The price bars are below the 21-day moving average and the 50-day moving average lines, which increases the likelihood of a further decline. Currently, BTC is below the 50% area of the daily stochastic. The crypto is in a bearish momentum.

Technical indicators:
Major Resistance Levels - $65,000 and $70,000
Major Support Levels - $60,000 and $55,000
What is the next direction for BTC?
BTC/USD has consolidated above the $47,000 support level. The downtrend has eased as the price has risen back above the $47,000 support. The price indicator has indicated a possible reversal in bitcoin. Meanwhile, on November 27, the downtrend has seen a retreating candle testing the 78.6% Fibonacci retracement level. The retracement suggests that BTC will fall to the 1,272 Fibonacci Extension level or $49,110.40.

Disclaimer. This analysis and forecast are the personal opinions of the author and are not a recommendation to buy or sell cryptocurrency and should not be viewed as an endorsement by CoinIdol. Readers should do their own research before investing funds.
Price
News
News
News
Price

(0 comments)