Bitcoin Slumps Face Second Rejection at $49,000, Revisits $44,000 Low
Updated: Aug 26, 2021 at 10:03

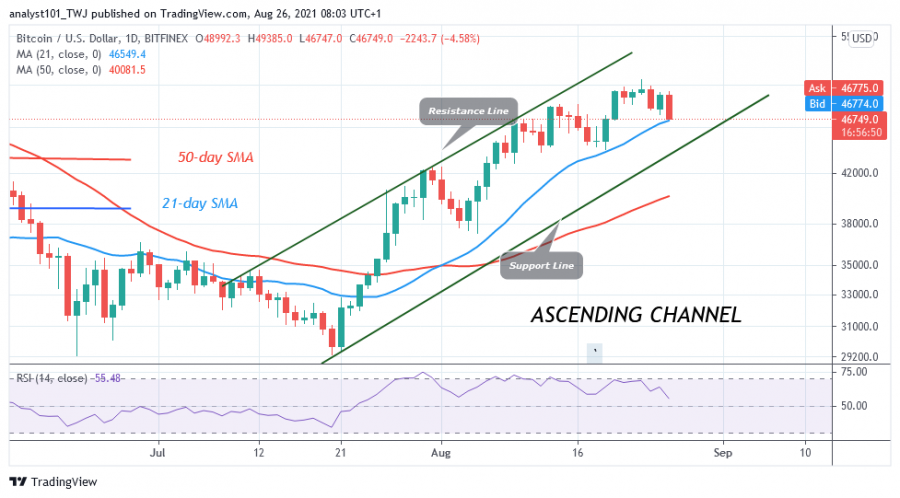
Today, the Bitcoin (BTC) price is falling back after hitting a high of $49,385. This is the second time it has been rejected at the psychological $50,000 price level.
In the previous attempt, buyers pushed the cryptocurrency to the high of $50,558 but were rejected when it reached the overbought region. Today, bitcoin has fallen to support above the 21-day line SMA. If the 21-day support SMA holds, the BTC price will move back up and retest the overhead resistance.
Conversely, if the price breaks below the 21-day line SMA, it means that the selling pressure will continue downwards. If selling pressure resumes, the downtrend will extend to the low of $45,000. If the $45,000 support fails to hold, the price of BTC will fall to the $42,000 breakout level. Meanwhile, Bitcoin is trading at $46,749 at the time of writing.
Bitcoin indicator reading
The Relative Strength Index has fallen to level 55. It indicates that the cryptocurrency is still in the bullish trend zone and above the midline 50. If the BTC price falls and breaks below the moving averages, it signals the resumption of the downtrend. The uptrend will continue as long as the price is above the moving averages. The cryptocurrency is below the 50% area of the daily stochastic. This indicates that the market is in a bearish momentum.

Technical indicators:
Major Resistance Levels - $65,000 and $70,000
Major Support Levels - $40,000 and $35,000
What is the next direction for BTC/USD?
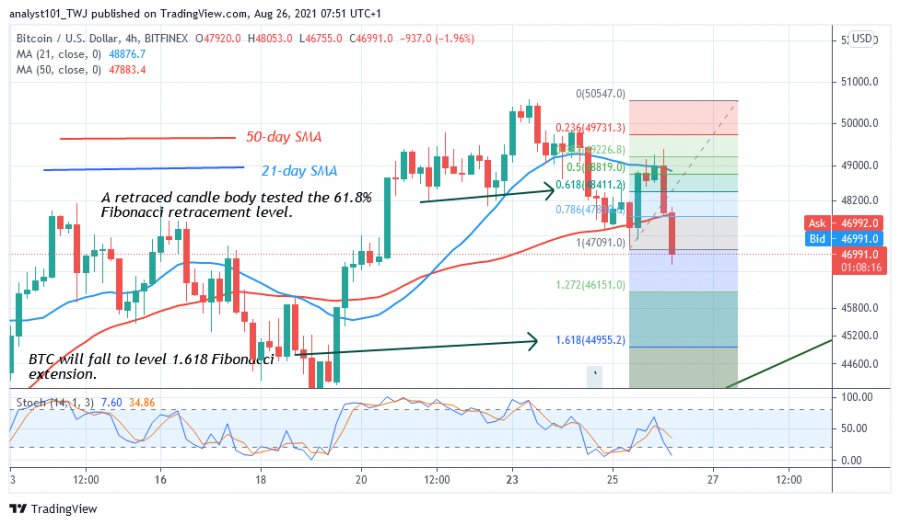
BTC/USD has resumed the downward movement due to the rejection of the psychological price level of $50,000. According to the price indicator, the market will continue to decline. Meanwhile, on the downtrend from August 25, a retracement candlestick tested the 61.8% Fibonacci level. The retracement suggests that Bitcoin will fall to the 1,618 Fibonacci Extension level or the $44,955.20 level.

Disclaimer. This analysis and forecast are the personal opinions of the author and are not a recommendation to buy or sell cryptocurrency and should not be viewed as an endorsement by CoinIdol. Readers should do their own research before investing funds.
Price
Price
News
Price
Price

(0 comments)