Binance Coin Resumes Selling Pressure and Tests $280 High
Updated: Sep 08, 2022 at 12:55

The price of Binance Coin (BNB) is in a downward correction as the cryptocurrency declines to regain previous lows.
Binance Coin price long term forecast: bearish
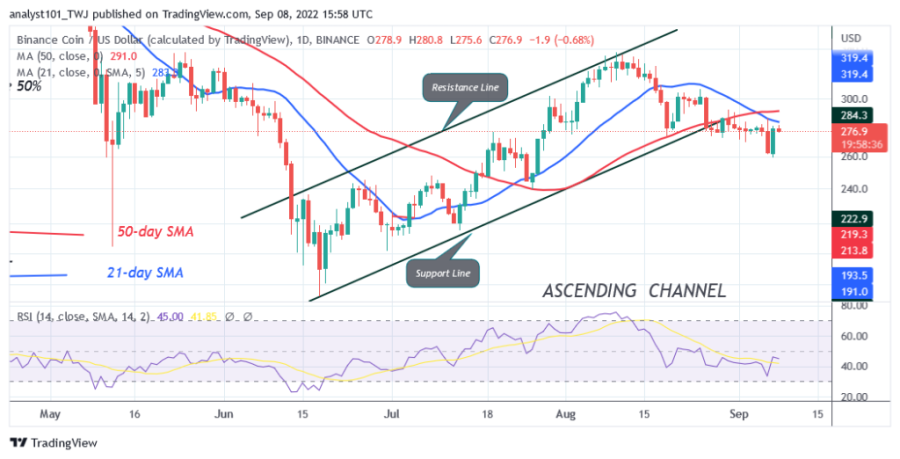
In the previous price action, BNB/USD has traded between $272 and $300 since August 19. Nevertheless, sellers broke through the $272 support on September 6, when the altcoin fell to a low of $261.50. However, buyers responded and pushed the price to the previous high.
Today, buyers are struggling to regain the previous support, which has turned into a resistance level. The cryptocurrency is also facing the resistance of the 21-day line SMA. The cryptocurrency will regain its bullish momentum if it breaks above the moving average lines. A break above the moving average lines will catapult BNB to a rally above the $334 high. On the other hand, if the altcoin turns away from the moving average lines, BNB will fall to a low of $261. Later, the bearish momentum will extend to the lows of $244 and $220.
Binance Coin indicator display
BNB is at level 45 of the Relative Strength Index for the period 14. The altcoin is in the bearish trend zone despite the upward correction. The cryptocurrency's price bars are below the moving average lines, indicating a further decline. BNB is above the 25% area of the daily stochastic. This indicates that the market is in a bullish momentum. The 21-day line SMA and the 50-day line SMA are sloping downward, indicating a downtrend.

Technical Indicators:
Key resistance levels - $600, $650, $700
Key support levels - $300, $250, $200
What is the next direction for BNB/USD?
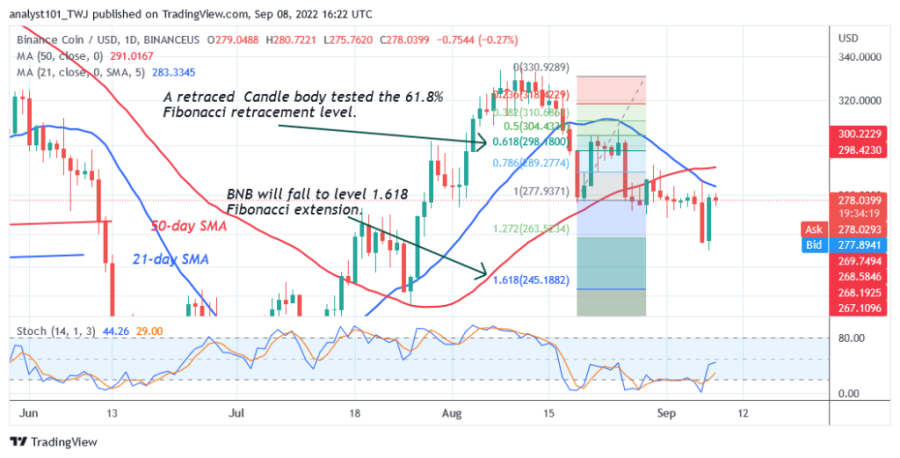
According to the Fibonacci tool, Binance Coin will continue to fall to the previous low. Meanwhile, on the downtrend from August 19, a retraced candle tested the 61.8% Fibonacci retracement level. The retracement suggests that BNB will fall to the 1,618 Fibonacci extension level or $245.18.

Disclaimer. This analysis and forecast are the personal opinions of the author and are not a recommendation to buy or sell cryptocurrency and should not be viewed as an endorsement by CoinIdol. Readers should do their research before investing in funds.
Price
News
Price
Price
Price

(0 comments)