Binance Coin Stuck Below $32 Overhead Resistance, a Breakdown Likely

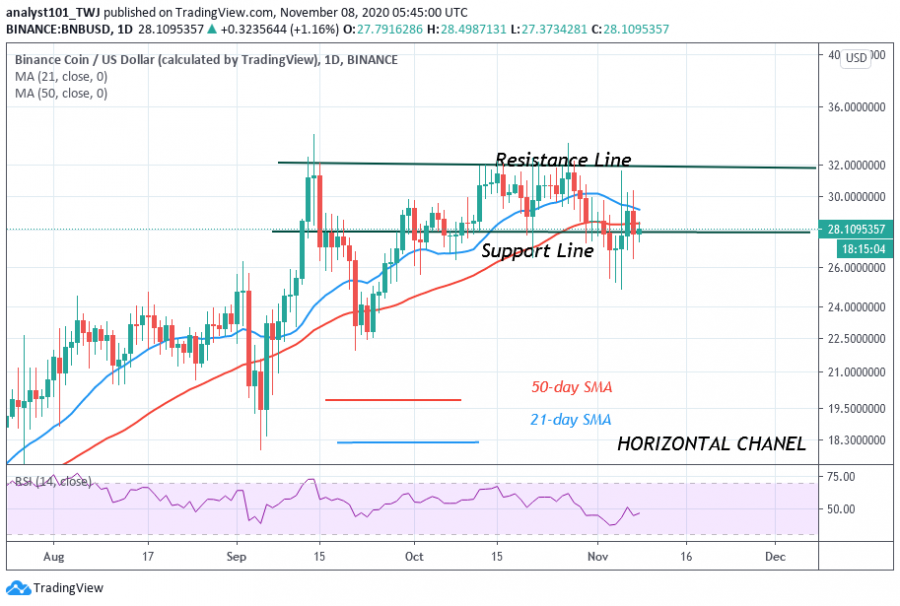
Today, Binance Coin is trading at $27.72 at the time of writing. Buyers have failed to push BNB above the $32 overhead resistance since September 13.
After three unsuccessful attempts to break the overhead resistance, the coin has resumed a sideways move below the resistance. Today, BNB is fluctuating between $28 and $32.
Nonetheless, if the consolidations between these ranges persist, the Coin may encounter a breakout or breakdown. In September, the first breakdown pushed the coin to reach a low of $22.50. Later, the coin rebounded at that low as price rallied into the range-bound zone. Today, there is a likelihood of another breakdown if the bulls fail to push above the SMAs.
Binance Coin indicator reading
BNB has fallen to level 45 of the Relative Strength Index period 14. It indicates that the coin tends to fall. Besides, if price breaks and closes below the support line of the horizontal channel, the downtrend will resume. Presently, the price is below the SMAs which suggest that the coin is likely to fall.

Key Resistance Zones: $23, $24, $25
Key Support Zones: $15, $14, $13
What is the next direction for BNB/USD?
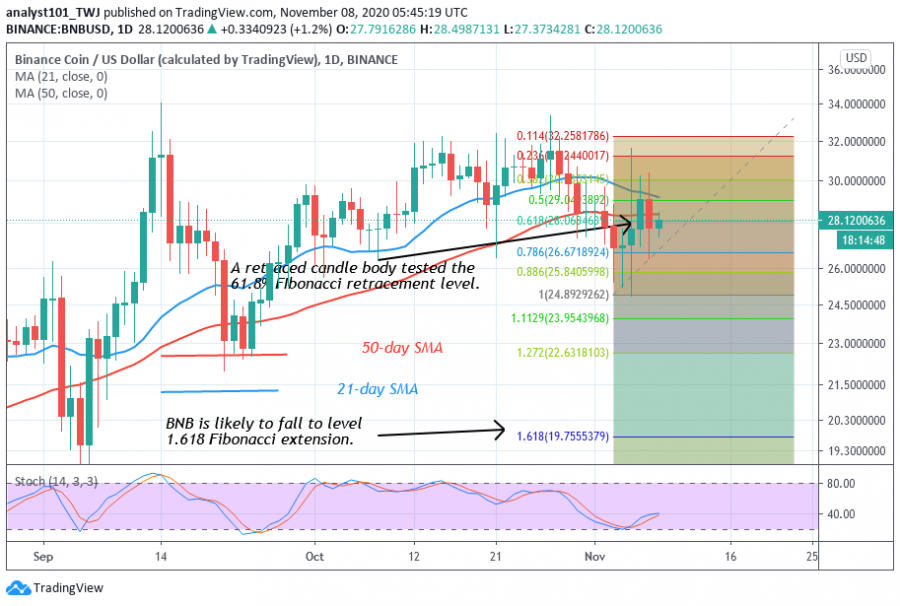
There is a possibility of a downward movement of price. On November 3 downtrend; a retraced candle body tested the 61.8% Fibonacci retracement level. This suggests that BNB is likely to fall to level 1.618 Fibonacci extensions. In other words, the market will reach a low of $19.75. Thereafter the price action will continue.

Disclaimer. This analysis and forecast are the personal opinions of the author that are not a recommendation to buy or sell cryptocurrency and should not be viewed as an endorsement by CoinIdol. Readers should do their own research before investing funds.
Price
Price
News
Coin expert
News

(0 comments)