Binance Coin Makes Lower Highs and Lower Lows, Continues Its Bearish Run

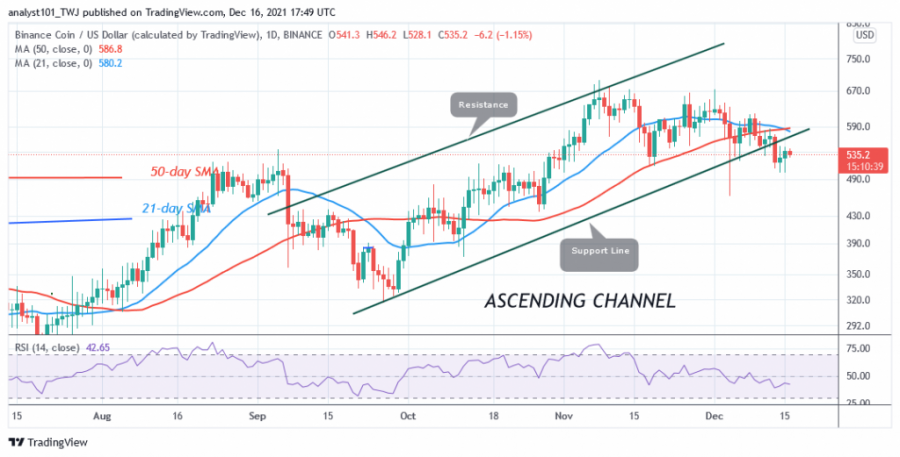
Binance Coin (BNB) price is now trading in the bearish trend zone. Sellers have broken below the moving averages, indicating further downside. Since November 26, the BNB price has posted a series of lower highs and lower lows.
During the December 4 dip, the altcoin hit a low of $461 as bulls bought the dips. Buyers pushed the cryptocurrency to a high of $616, while bears sold the rallies. Binance Coin is likely to fall lower if the bearish pattern continues. Today, the altcoin hit a lower high of $550 as selling pressure picked up. A subsequent decline could reach the low of $478.
Binance Coin indicator reading
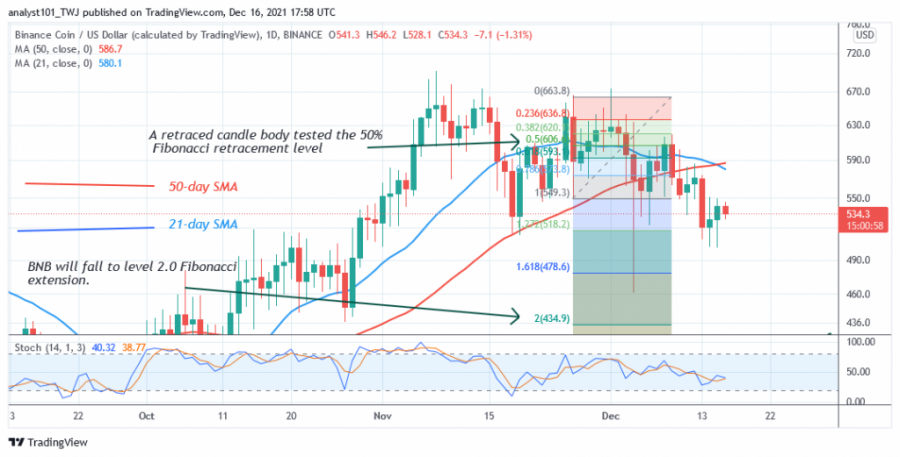
Given the recent decline, BNB is at level 43 on the Relative Strength Index for period 14, which means it is in a downtrend and can fall lower. It is below the 50% area of the Stochastic on the daily chart. BNB/USD is in a bearish momentum.

Technical indicators:
Major Resistance Levels - $700 and $750
Major Support Levels - $400 and $350
What is the next direction for BNB?
The cryptocurrency is in a downtrend as the price is showing a series of bearish patterns. Meanwhile, on November 26, the downtrend has seen a retreating candlestick testing the 50% Fibonacci retracement level. The retracement suggests that BNB will fall to the 2.0 Fibonacci extension level, or $434.90. From the price action, BNB is falling after the recent low.

Disclaimer. This analysis and forecast are the personal opinions of the author and are not a recommendation to buy or sell cryptocurrency and should not be viewed as an endorsement by CoinIdol. Readers should do their own research before investing funds.
Price
Price
Price
Price
Price

(0 comments)