Litecoin Stops At $84 As It Is Forced To A Narrow Range

The price of Litecoin (LTC) has been falling in a sideways pattern. Price analysis by Coinidol.com.
Litecoin price long-term forecast: ranging
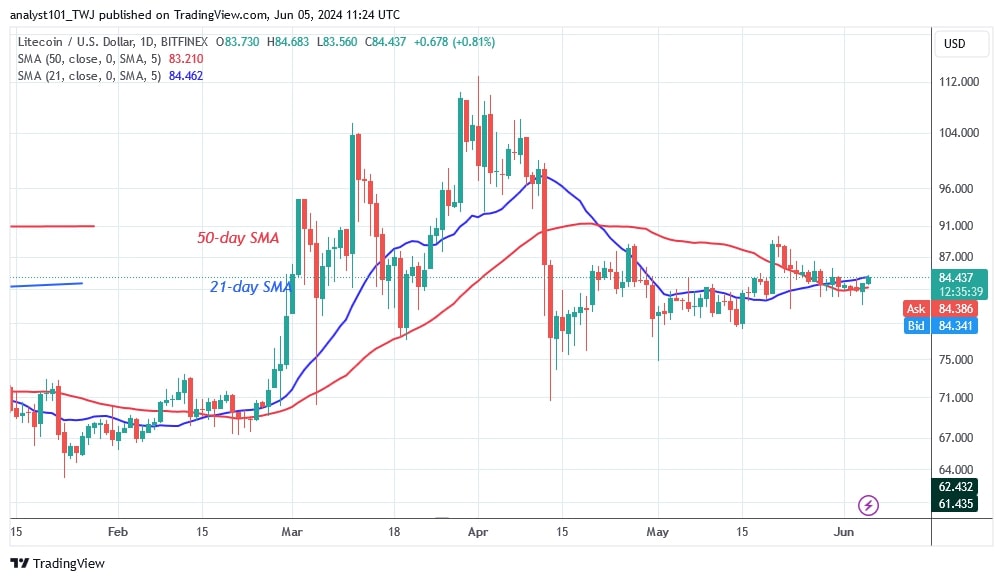
The altcoin fell to a low of $81 before recovering. The price of the cryptocurrency has been moving between the moving average lines. If the altcoin breaks above the 21-day moving average line, it will move into the positive trend zone. The uptrend encounters initial resistance at $84 or the 21-day moving average line. If Litecoin breaks the barrier at $84, it will rise to a high of $89 per coin.
Furthermore, the positive momentum will extend to a high of $103 if the resistance at $89 is broken. Currently, Litecoin is hovering around $84.
Litecoin indicator analysis
The price of LTC is rising but is blocked by the 21-day moving average line. Litecoin is currently trading between the 21-day and 50-day SMA. The price movement has been stymied by the presence of indecisive candles with small bodies known as dojis. The moving average lines run parallel to each other.
Technical Indicators
Resistance levels: $100, $120, $140
Support levels: $60, $40, $20

What's next for Litecoin?
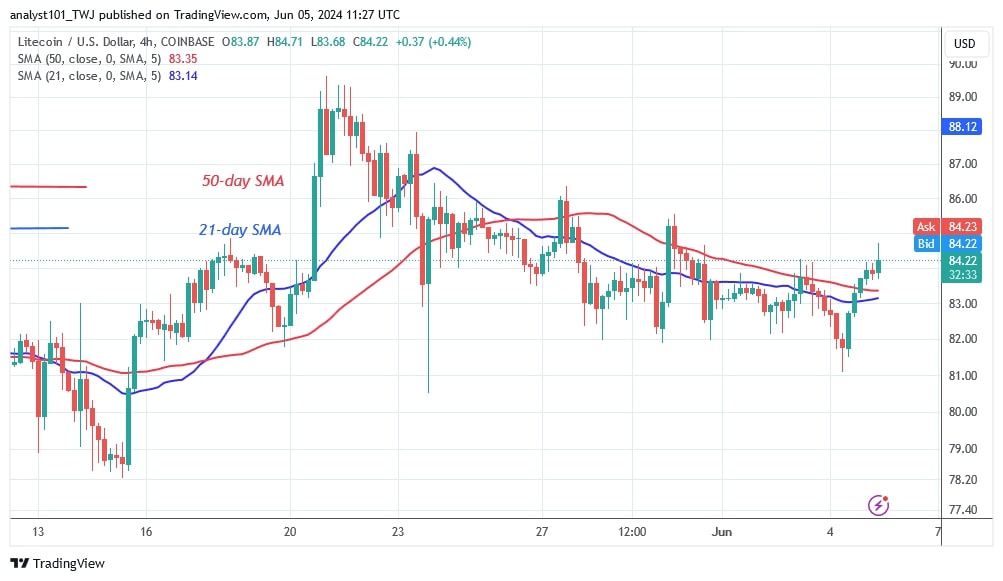
On the 4-hour chart, Litecoin has fallen below the moving average lines after a series of lower highs and lower lows. The rally was halted at a high of $84. Litecoin is currently trading in a tight range between $82 and $86. Range-bound movement will continue once the doji candlesticks materialize.

Disclaimer. This analysis and forecast are the personal opinions of the author and are not a recommendation to buy or sell cryptocurrency and should not be viewed as an endorsement by CoinIdol.com. Readers should do their research before investing in funds.
Price
News
Price
Price
News

(0 comments)