Solana Price Holds Above The Breakout Level Of $162
Updated: Jun 05, 2024 at 19:49

The price of Solana (SOL) has fallen below the 21-day moving average line, suggesting that selling pressure could pick up again.
Long-term forecast for the Solana price: bearish
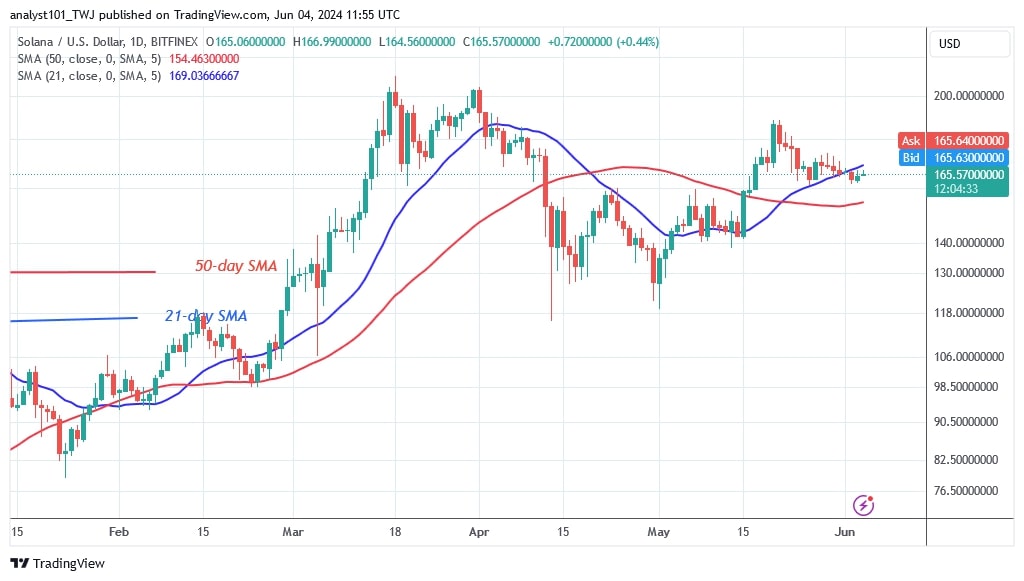
On June 2, SOL fell below the 21-day SMA and reached support at $161. The bears intend to push the altcoin above the 50-day SMA or the $155 support. If the altcoin falls below the moving average lines, Solana will retest its previous low of $142. Meanwhile, SOL/USD is worth $166 and is trapped between the moving average lines. The cryptocurrency will rally once it breaks through one of the moving average lines.
Analysis of the Solana price indicator
Solana is below the 21-day SMA support. Solana was moving above the moving average lines with resistance at $188. The recent slide below the 21-day SMA has pushed the altcoin lower. The price of the cryptocurrency is defined by a Doji candlestick, which has slowed the price movement.
Technical indicators
Important supply zones: $200, $220, $240
Important demand zones: $120, $100, $80

What is the next development for Solana?
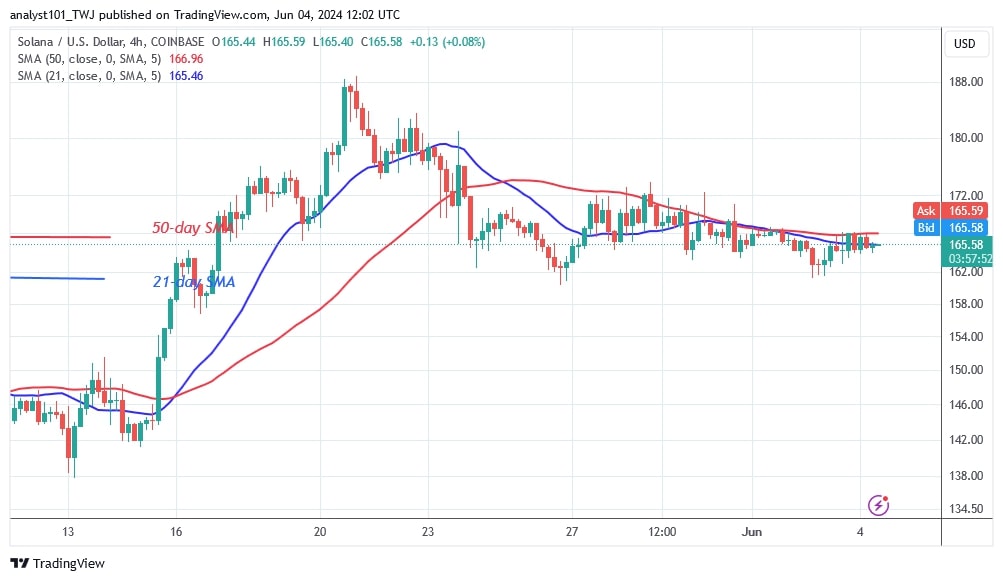
On the 4-hour chart, Solana is in a sideways trend but is trading within a limited range. The price of the cryptocurrency remains within a limited range of $162 to $172. The price action has been dominated by doji candlesticks that have kept it in a narrow range. Solana will remain range-bound for a few more days.

Disclaimer. This analysis and forecast are the personal opinions of the author and are not a recommendation to buy or sell cryptocurrency and should not be viewed as an endorsement by CoinIdol.com. Readers should do their research before investing in funds.
Price
Price
Price
Price
News

(0 comments)