Bitcoin Cash Declines as Bulls Turn Down From $470 Resistance

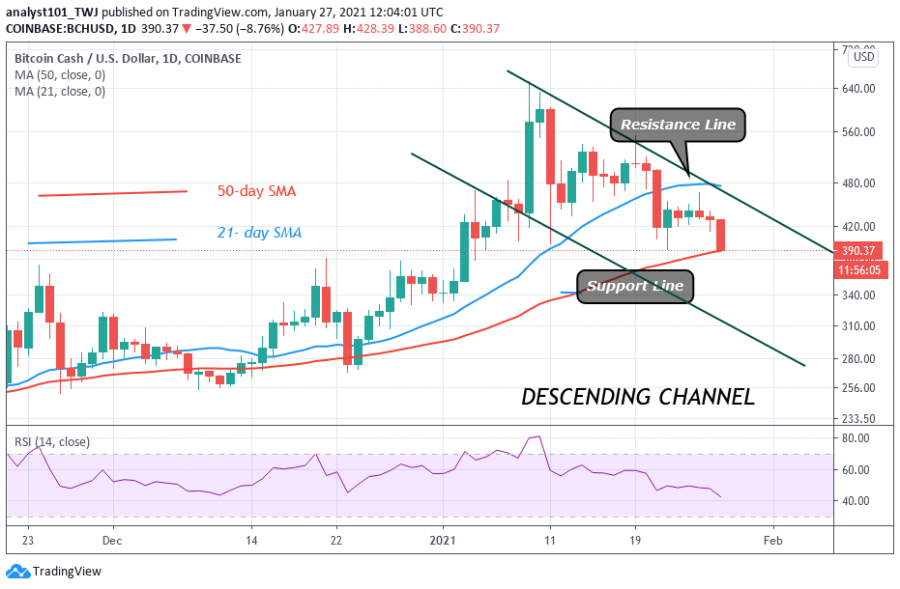
Today, January 27, 2021, Bitcoin Cash (BCH) has fallen to $389 low after rejection from the $470 resistance.
Bitcoin Cash price Long-term Analysis: Bullish
The current downtrend is the result of the bulls failing to break the $540 resistance. Consequently, BCH dropped to $391 low. Buyers reacted and pushed the price to the previous high which resulted in a rejection.
After the rejection, the downtrend resumes which indicate that selling pressure will persist. In the meantime, the bears have broken below the $400 support.
There is a likely tendency for the crypto to further decline to the lows of either $340 or $360. BCH is trading at $395 at the time of writing.
Bitcoin Cash Indicator Reading
BCH price has broken the 21-day SMA and it is testing to break the 50-day SMA. A break below the SMAs will push the coin into the bearish trend zone. In the bearish trend zone, the coin tends to fall. Bitcoin Cash is now at level 43 of the Relative Strength Index period 14. It indicates that BCH is in the downtrend zone and may further decline.

Key Resistance Zones: $560, $580, $600
Key Support Zones: $240, $220,$200
What Is the Next Move for Bitcoin Cash (BCH)?
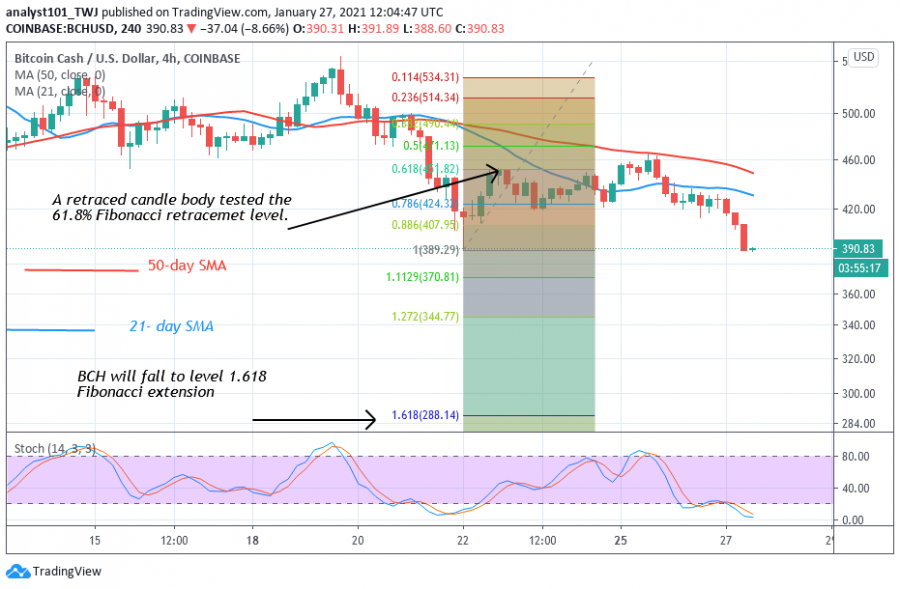
BCH has corrected upward but was rejected at the $470 resistance which signals a further downward movement of the coin. On January 22 downtrend; the retraced candle body tested the 61.8% Fibonacci retracement level. The retracement indicates that BCH is likely to rise to level 1.618 Fibonacci extensions. In other words, BCH will fall to a low of $288.14.

Disclaimer. This analysis and forecast are the personal opinions of the author and not a recommendation to buy or sell cryptocurrency and should not be viewed as an endorsement by Coin Idol. Readers should do their own research before investing funds.
Coin expert
News
Coin expert
Price
Price

(0 comments)