Bitcoin Cash Rally Stalls at $360 Resistance, Buyers Recoup Above $250 Support
Updated: Nov 27, 2020 at 15:55

Following the recent price surge above $360 resistance on November 24, the Bitcoin Cash (BCH) uptrend has been terminated.
Bitcoin Cash price Long-term Analysis: Bullish
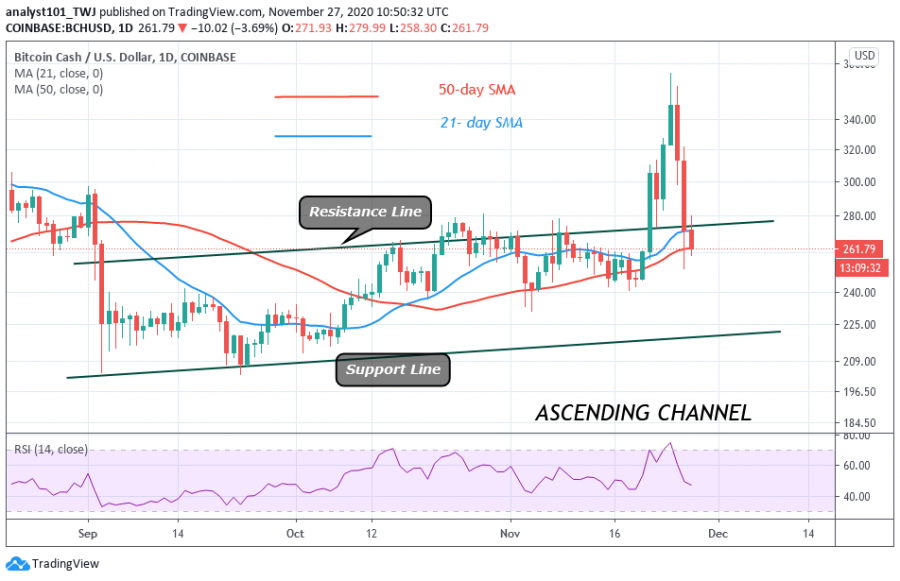
On November 24 and 25, the candlesticks of various shapes were displacing long wicks. These long wicks indicate that there is strong selling pressure at higher price levels. Consequently, the bears overpowered the bulls as the coin crashed to $251 low. The price has corrected upward to retest the $280 high but the selling pressure is persisting. On the downside, if price breaks below the $251 support, the downtrend will resume.
On the other hand, the upside momentum will resume, if the $251 support holds. The coin has resumed retesting the previous price levels. In the meantime, the coin is falling and has reached a low of $264. Nevertheless, the support at $250 is likely to hold as the candlesticks are displacing long tails. This indicates that there is buying pressure at a lower price level. It implies an imminent upward move of the coin.
Bitcoin Cash Indicator Reading
BCH price has broken below the SMAs but not completely. The coin will resume a downward move if price breaks below the SMAs. The price also breaks below the resistance line of the ascending channel. The implication is that price will be fluctuating within the channel.

Key Resistance Zones: $440, $480, $520
Key Support Zones: $200, $160, $120
What Is the Next Move for Bitcoin Cash (BCH)?
BCH is still in a downward move as it approaches the critical support level. According to the Fibonacci tool, BCH is likely to fall. On November 26 downtrend; a retraced candle body tested the 88.6% Fibonacci retracement level. This implies that the market will fall to level 1.1189 Fibonacci extensions or $264.50 low. Perhaps the upward move will resume at that price level.

Disclaimer. This analysis and forecast are the personal opinions of the author and not a recommendation to buy or sell cryptocurrency and should not be viewed as an endorsement by Coin Idol. Readers should do their own research before investing funds.
News
Coin expert
Politics
Price
Price

(0 comments)