Avalanche Slumps Amid Fears Of Falling To $19
Updated: Sep 28, 2025 at 16:24
Avalanche's (AVAX) price has dropped below the 21-day SMA support after encountering resistance at $35.72.
The cryptocurrency is now trading below the 21-day SMA but remains above the 50-day SMA support. The altcoin fell sharply after buyers failed to sustain momentum above the $36 overhead resistance.
Avalanche price long-term analysis: bearish
Today, AVAX has resumed its downward movement towards the 50-day SMA support. According to price indicators, AVAX is expected to fall below the moving average lines. On 22 September, a retraced candle body tested the 38.2% Fibonacci retracement level. This retracement suggests the crypto could fall to the 2.618 Fibonacci extension, or $19.12. Now, AVAX has reached a low of $28. On the downside, if bears break through the 50-day SMA support, AVAX is likely to reach the projected price level.
Technical Indicators:
-
Resistance Levels – $60 and $70
-
Support Levels – $30 and $20
AVAX price indicators analysis
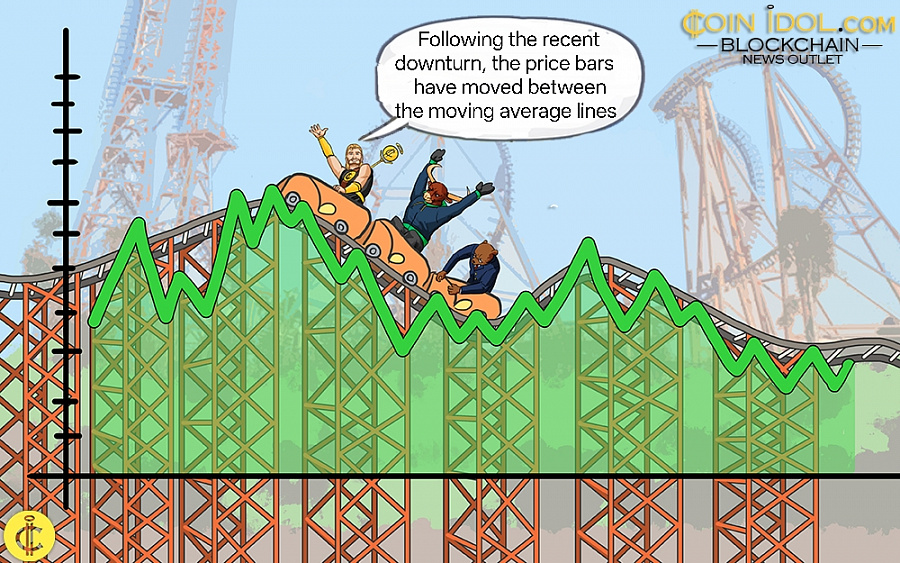
Following the recent downturn, the cryptocurrency's price bars have moved between the moving average lines. The altcoin will trend if either the 21-day or 50-day SMA is broken. Despite the decline, the 21-day and 50-day SMAs are currently moving upward. On the 4-hour chart, however, the moving average lines are sloping downward, indicating a downtrend.
 - Sept.27, 2025")
AVAX/USD daily chart - September 27, 2025
What is the next move for AVAX?
The 4-hour chart shows AVAX declining below the moving average lines. The altcoin has fallen but remains above the $27 support. It is currently trading above the $27 support but below the moving average lines. Doji candlesticks are slowing the price movement. According to the price indicator, the crypto signal is negative because it has entered the bearish trend zone.
 - Sept.27, 2025")
AVAX/USD 4-hour chart - September 27, 2025
Disclaimer. This analysis and forecast are the personal opinions of the author. The data provided is collected by the author and is not sponsored by any company or token developer. This is not a recommendation to buy or sell cryptocurrency and should not be viewed as an endorsement by Coinidol.com. Readers should do their research before investing in funds.
Price
Price
Price
News
News

(0 comments)