Weekly Cryptocurrency Market Analysis: Altcoins Are In A Range While Waiting For A Possible Upswing
Updated: Aug 11, 2023 at 13:51

Weekly cryptocurrency analysis of XDC, MNT, XRP, COMP and OP brought to you by Coinidol.com.
This week cryptocurrencies are trading in a bearish trend zone. Altcoins below the moving average lines are attracting buyers at lower price levels. Other altcoins are stuck between the moving average lines waiting for a possible comeback or crash.
XDC Network
The price of XDC Network (XDC) is falling but remains above the moving average lines. After reaching the target price of $0.093, the crypto asset retraces above the moving average lines. At the time of writing, the altcoin is trading at $0.064. The cryptocurrency has retreated into the bullish trend zone while remaining above the moving average lines. If the current support holds, the market will rise again and reach the previous high of $0.093. The price will resume its downtrend if it falls below the 21-day moving average line. Meanwhile, the altcoin is at a Relative Strength Index level of 54 for the period 14. XDC is the worst cryptocurrency, with the following characteristics:
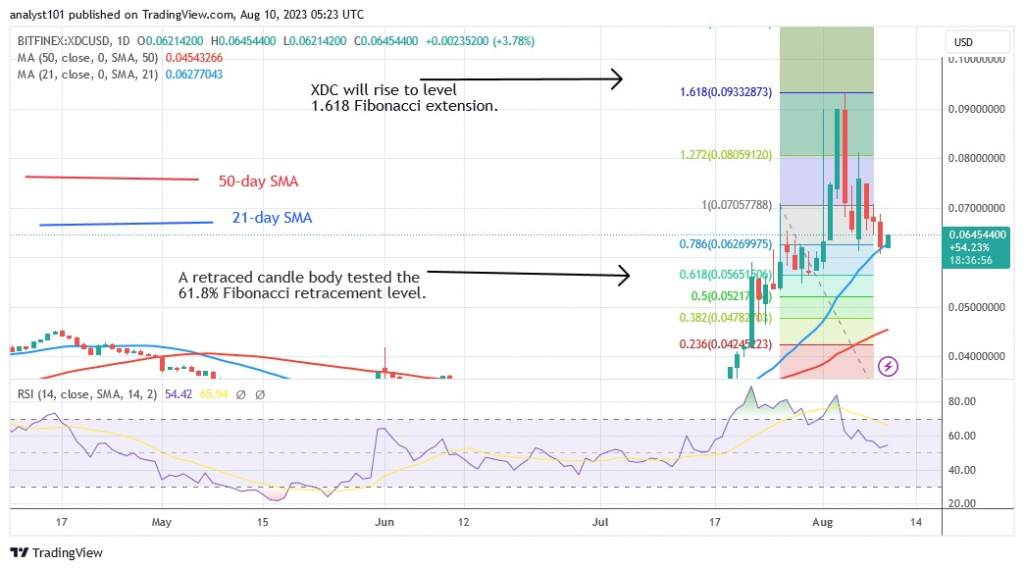
Current price: $0.06434
Market capitalization: $2,425,820,609
Trading volume: $17,574,842
7–day loss: 24.29%
Mantle
The price of Mantle (MNT) is declining and has dropped significantly. The cryptocurrency fell from a high of $0.60 to a low of $0.44 as bulls bought dips. MNT is currently trading at $0.46 as we write this article. The market has reached an oversold area as a result of the decline. MNT has reached a point of bearish exhaustion. The cryptocurrency's price is expected to move between $0.44 and $0.47. The cryptocurrency currently has a Relative Strength Index of 18 for the period of 14. MNT is the second lowest performing cryptocurrency and has the following characteristics:
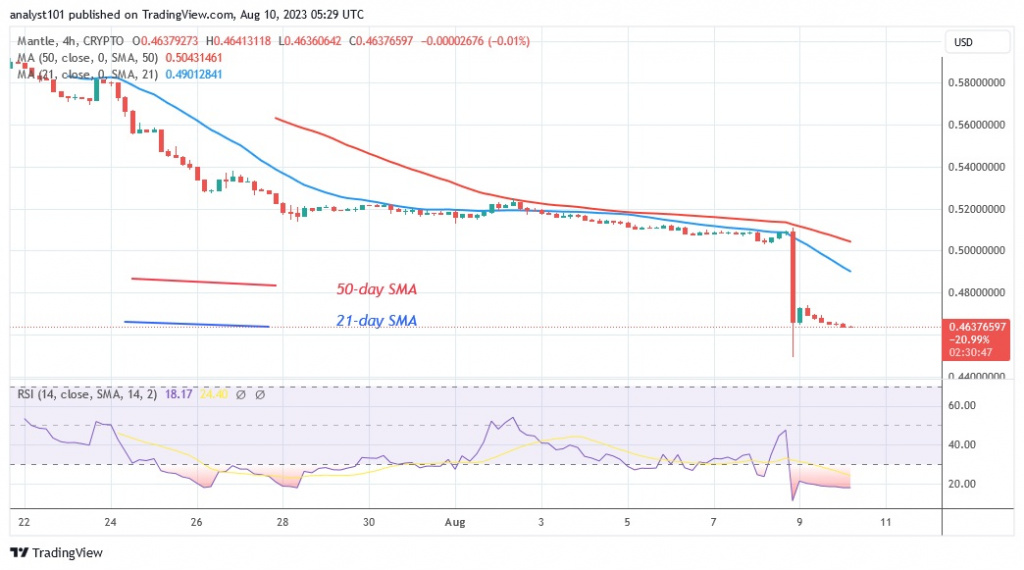
Current price: $0.4658
Market capitalization: $2,897,208,230
Trading volume: $14,239,990
7–day loss: 10.64%
XRP
The price of XRP (XRP) is falling and trading between the moving average lines. The cryptocurrency has been trapped between the moving average lines since July 31. At the time of writing, XRP is trading at $0.62. The cryptocurrency value is falling as it approaches the 50-day simple moving average. If the 50-day support SMA is violated, the negative trend will extend to a low of $0.55. The 50-day support SMA must hold for XRP to move in a range. The cryptocurrency value will fluctuate between the moving average lines for a few days. XRP will rise to its previous high of $0.85 if the price rises above the 21-day line SMA and resistance at $0.70. Meanwhile, the altcoin is at a Relative Strength of 43 for the period 14. It is the third worst performing coin in terms of performance. The characteristics are as follows:
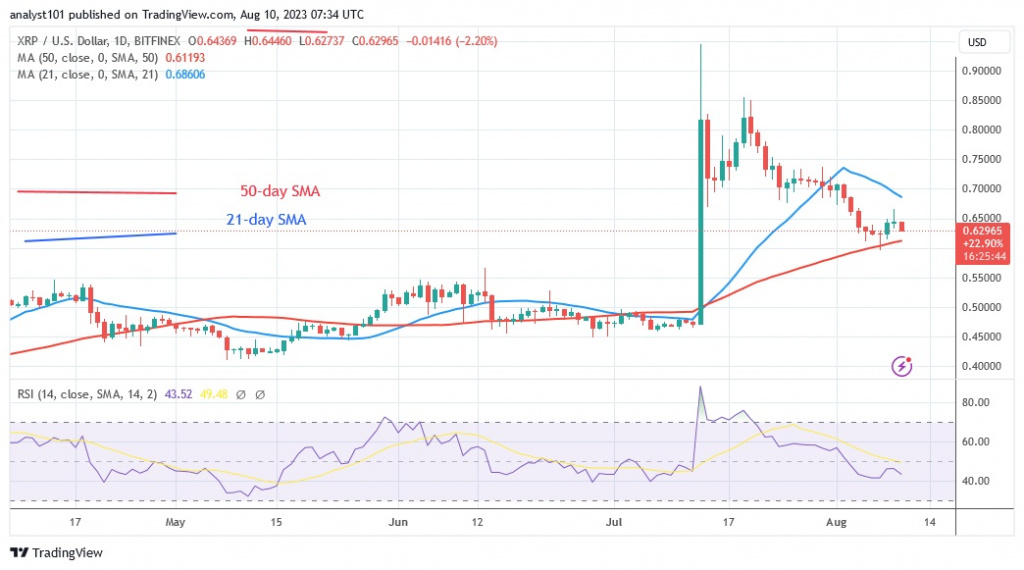
Current price: $0.6259
Market capitalization: $62.880.084.569
Trading volume: $1,716,129,284
7–day loss: 6.43%
Compound
The price of Compound (COMP) is falling below the moving average lines. COMP was trading sideways below the overriding resistance at $80 in the last price action. The altcoin fell after two failed attempts to break through resistance. COMP has fallen to a low of $55.97 today and could fall further to the previous low of $40. It is currently trading above the $53 support level. The cryptocurrency has fallen below the Relative Strength Index value of 40 for the period 14. COMP is in a negative trend and could fall further. It is the coin that has performed the fourth worst. It has the following characteristics:
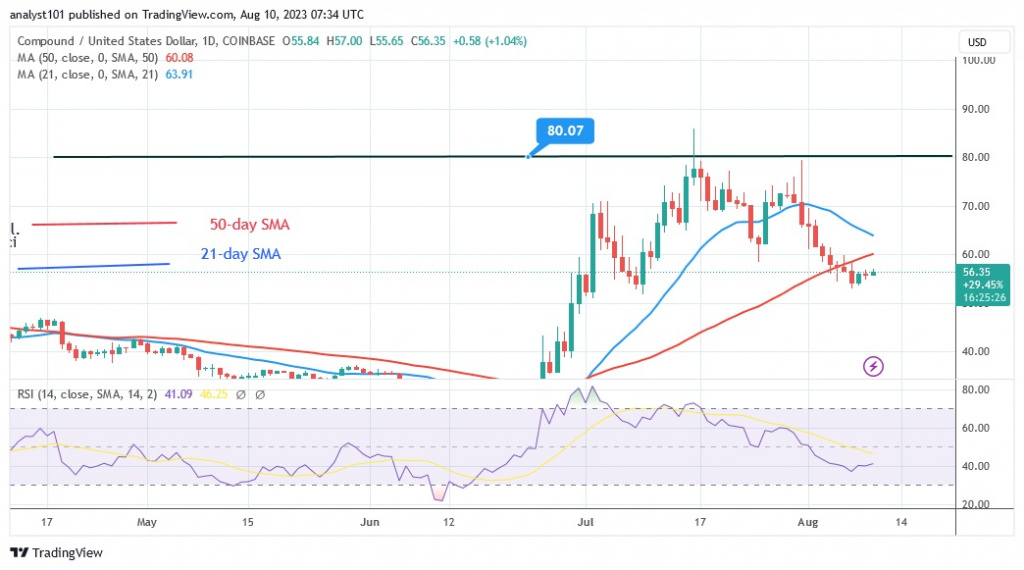
Current price: $56.01
Market capitalization: $564,137,973
Trading volume: $56,506,366
7–day loss: 6.10%
Optimism
Optimism (OP) has crossed above the moving average lines and is currently correcting higher. The uptrend is encountering resistance at the $1.80 high. OP is currently trading below the 21-day line SMA, but above the 50-day line SMA. Currently, the cryptocurrency is trapped between the moving average lines. The cryptocurrency value will be forced to move in a range between the moving average lines. If the moving average lines are violated, the cryptocurrency will rise or fall. OP is currently recovering after falling to a low of $1.52. A break above the 21-day line SMA will take the altcoin back to its previous high of $1.80. The altcoin is in a downtrend below the Stochastic daily value of 30. The fifth worst cryptocurrency is OP. It has the following characteristics:
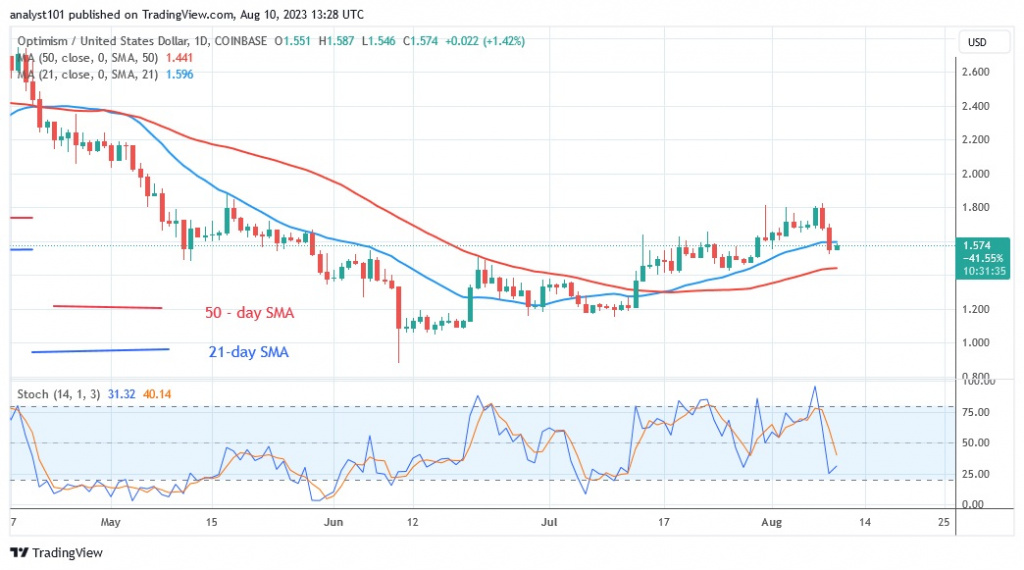
Current price: $1.57
Market capitalization: $6,786,480,089
Trading volume: $194,513,876
7–day loss: 5.94%
Disclaimer. This analysis and forecast are the personal opinions of the author and are not a recommendation to buy or sell cryptocurrency and should not be viewed as an endorsement by CoinIdol.com. Readers should do their research before investing in funds.
Price
Price
Price
Price
Price

(0 comments)