Weekly Cryptocurrency Market Analysis: Altcoins Consolidate As They Show Signs Of Breakout

Almost every altcoin on the following list has seen a sharp drop in price and reached its lowest levels.
The depressing trend in cryptocurrencies has ended. Cryptocurrency prices are currently consolidating above their respective support levels after hitting their lows. We will discuss these cryptocurrencies in detail.
Huobi Token
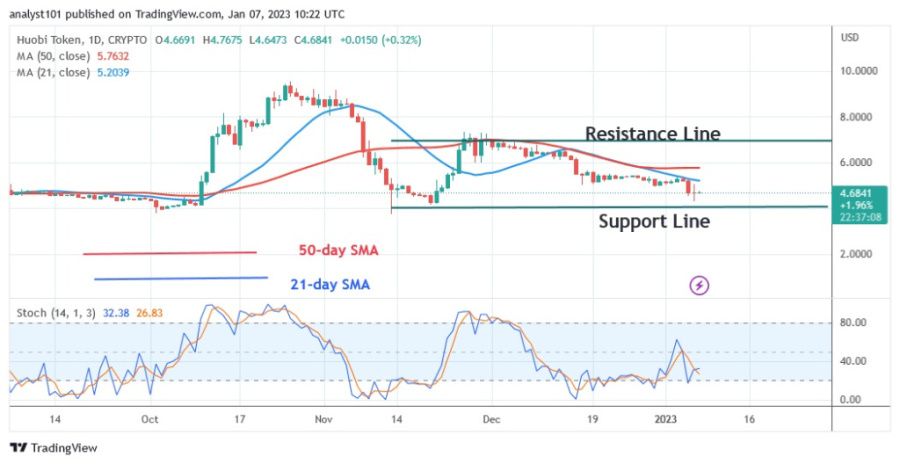
The price of the Huobi Token (HT) is currently declining after falling on November 13. On Nov. 13, HT fell to a level above $3.75, which is serving as support today as the bulls bought the dips. The bullish momentum peaked at $7.00 but failed to continue. The altcoin has been moving sideways between $4.00 and $7.00 since November 26. HT is currently capped by the moving average lines or resistance at $6.00, making an upside move uncertain. In the meantime, price action is dominated by doji candlesticks, so movement within the trading range could continue. Below the daily stochastic level of 40, HT is in a bearish momentum. Among all cryptocurrencies, its performance was the worst last week. The cryptocurrency's attributes include:
Current price: $4.69
Market capitalization: $2,344,271,173
Trading volume: $9,184,050
7-day gain/loss %: 7.70%
TRON
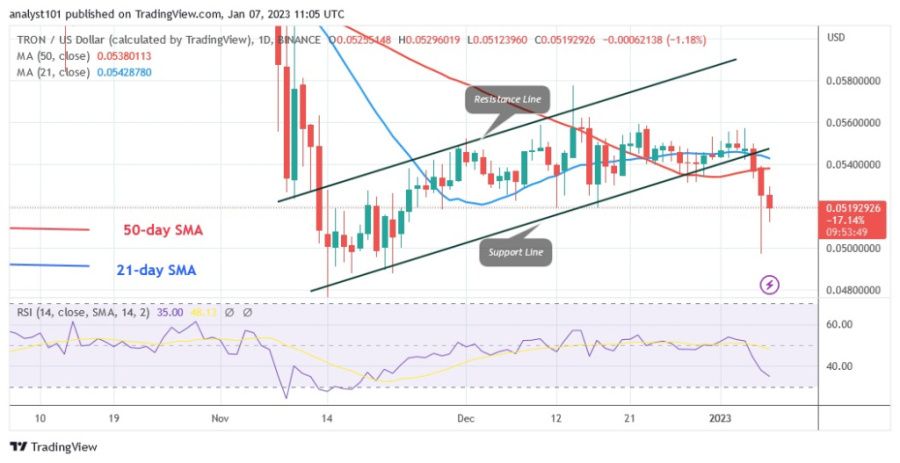
TRON (TRX) is currently declining as buyers were unable to keep the price above the $0.056 resistance. TRON has made an upward correction since the price declined on November 14. The price of the cryptocurrency rose above the moving average lines, but fell below the resistance of $0.056. The cryptocurrency value fell to the support level of $0.04, but then recovered. The Relative Strength Index of TRON is currently at 35. The altcoin is approaching the oversold zone of the market. The second worst performance of the week belongs to TRON. It has the following characteristics:
Current price: $0.05186
Market capitalization: $4,760,474,413
Trading volume: $402,669,351
7-day gain/loss %: 5.68%
Chain
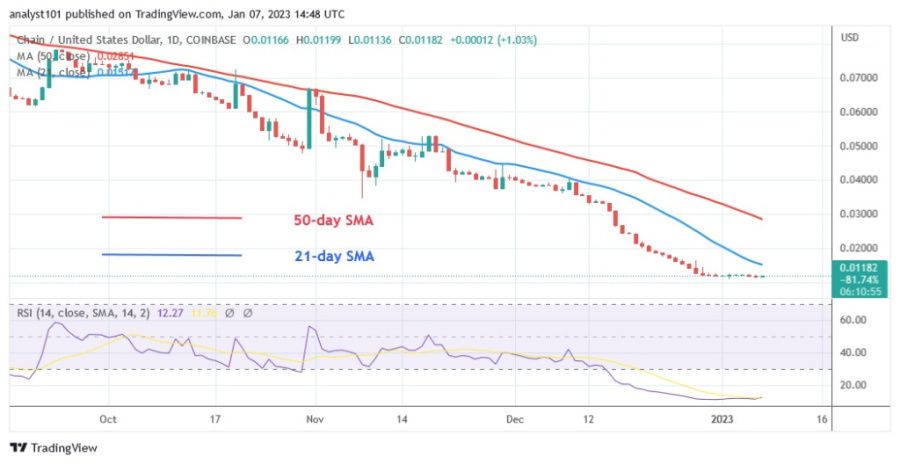
The price of Chain (XCN) has decreased and is at the bottom of the chart. The crypto asset has fallen from its high of $0.107 to its current level of $0.011. The altcoin has dropped significantly into oversold territory. The descent has reached bearish fatigue. Doji candlesticks, which have a small body and lack determination, were used to define the price movement. The lower part of the chart is dominated by doji candlesticks. For period 14 of the Relative Strength Index, the altcoin is at level 11. In the oversold zone, the altcoin has declined drastically. It is the third worst performance this week. The cryptocurrency's characteristics include:
Current price: $0.0118
Market capitalization: $631,988,493
Trading volume: $4,522,054
7-day gain/loss %: 4.04%
Internet Computer
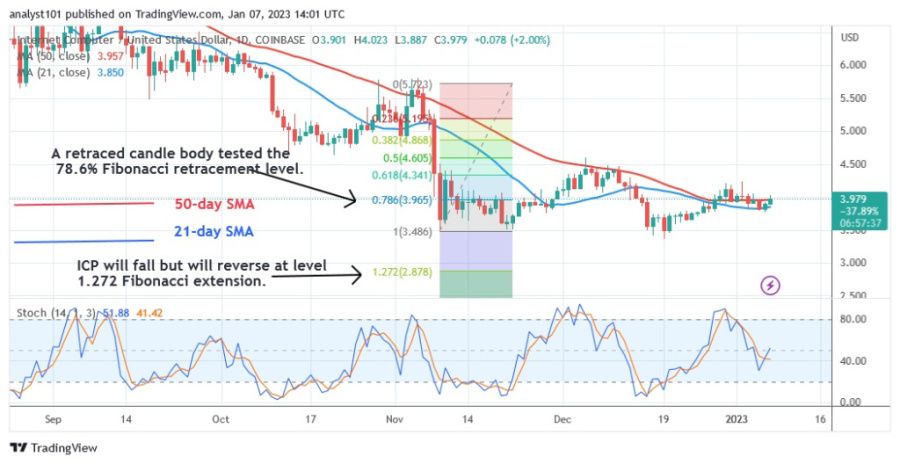
The price of Internet Computer (ICP) is falling below the moving average lines. After the price decline on November 9, the cryptocurrency asset started to move sideways. Since November 9, buyers have defended the current support. The altcoin is currently trading in a restricted range between $3.50 and $4.50. The moving average lines are between the price bars, indicating that the cryptocurrency can move in a range. ICP made an upward correction after the decline on November 9 and a candlestick tested the 78.6% Fibonacci retracement level. After the correction, ICP will decline but reverse at the 1.272 Fibonacci extension level or $2.87. Above the daily stochastic level of 40, the altcoin is in a bullish momentum. ICP, the fourth worst performing cryptocurrency, has the characteristics listed below:
Current price: $3.98
Market capitalization: $1,966,928,355
Trading volume: $18,554,584
7-day gain/loss %: 3.41%
UNUS SED LEO
The price of UNUS SED LEO (LEO) is declining and has dropped significantly to the bottom of the chart. Every time the cryptocurrency retests the moving average lines, its price falls. Since June 27, LEO has been falling as buyers have failed to keep the price above the moving average lines. The bottom of the chart or the oversold area of the market has been reached by the current decline. LEO is currently at the daily stochastic level 20. According to the chart, LEO is heavily oversold in the market. The coin with the fifth worst performance is LEO. It has the following characteristics:
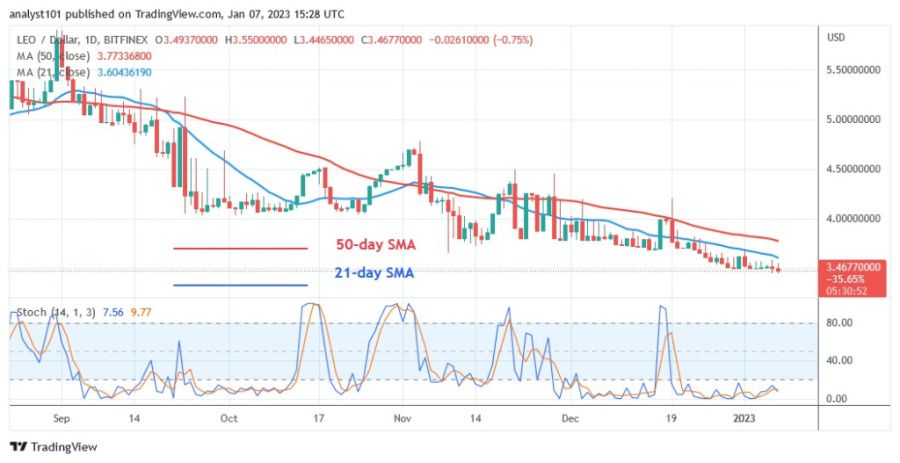
Current price: $3.46
Market capitalization: $3,411,101,847
Trading volume: $2,505,411
7-day gain/loss %: 2.88%
Disclaimer. This analysis and forecast are the personal opinions of the author and are not a recommendation to buy or sell cryptocurrency and should not be viewed as an endorsement by CoinIdol. Readers should do their research before investing in funds.
News
Price
News
Price
Price

(0 comments)