Weekly Cryptocurrency Market Analysis: Altcoins Decline And Surpassed Previous Lows
Coinidol.com analyzing cryptocurrency market. The 5 worst performers last week: Conflux, Stacks, Algorand, Graph and BitDAO coins.
The collapse of cryptocurrencies was caused by the deteriorating trend. Altcoins are trapped between the moving average lines as they try to overcome them. The cryptocurrencies occasionally fall as the moving average lines continue to reject them. Coinidol.com analysts briefly discuss a few of these cryptocurrencies.
Conflux
Conflux (CFX) has fallen below its moving average lines. Prior to its fall, the cryptocurrency was in a sideways trend. Buyers tried three times to keep the price above the $0.45 barrier, but were beaten back each time. At the time of writing, CFX is trading at $0.20.
Conflux is now trading between the moving average lines. If the bears break below the 21-day line SMA, the cryptocurrency will return to its previous low of $0.15. On the positive side, if the buyers keep the price above the moving average lines, the altcoin will regain the overhead resistance. For period 14, the altcoin is at level 41 of the Relative Strength Index. The altcoin has the potential to fall even further. The worst cryptocurrency is CFX.
It has the following characteristics:
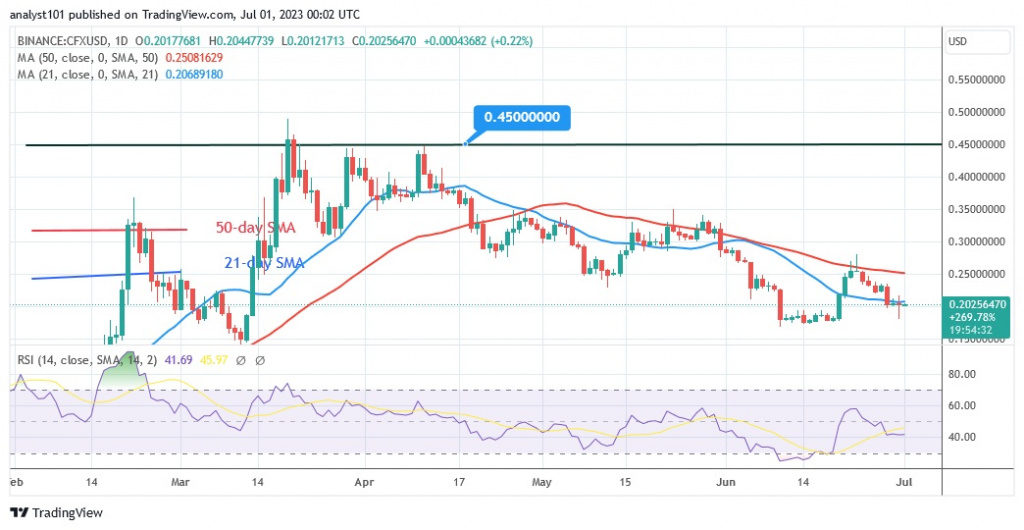
Current price: $0.202
Market capitalization: $1,065,535,417
Trading volume: $143M
7–day loss: 11.92%
Stacks
Stacks (STX) fall below the moving average lines. The price indicator forecasts that the altcoin will fall to a low of $0.48. Based on price activity, the altcoin has fallen to the previous low of 1.618 Fibonacci or $0.48.
STX fell to a low of $0.44 on June 10 as bulls bought the dips. The altcoin rose above the moving average lines but encountered resistance at $0.80. If the price stays above the moving average lines, the uptrend will resume.
STX will overcome the resistance at $0.80 and rise to a high of $1.20. The uptrend will resume if the price stays above the moving average lines.44. STX is still in the uptrend zone. It is at the level 54 of the Relative Strength Index for the period 14.
Below are the characteristics of the cryptocurrency with the second worst performance.
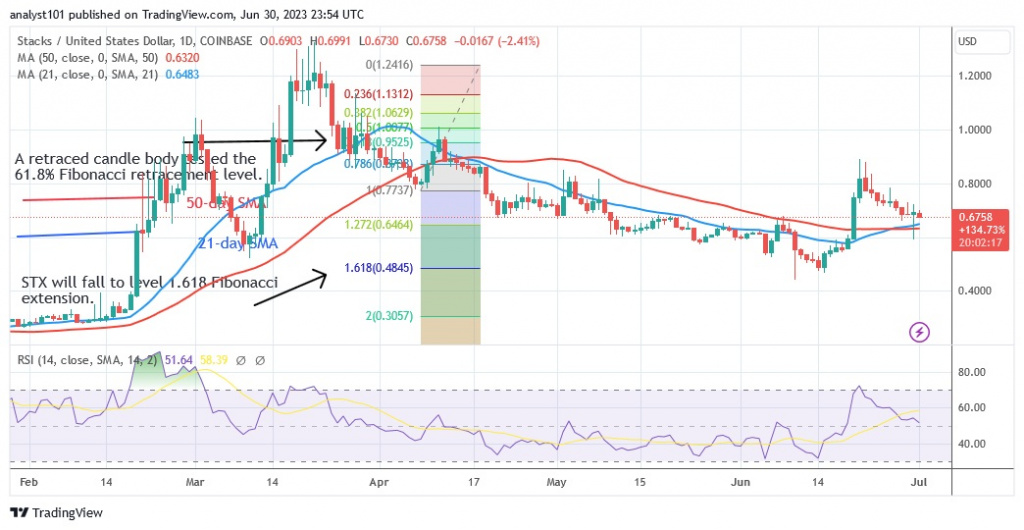
Current price: $0.6748
Market capitalization: $1,222,000,224
Trading volume: $149M
7–day loss: 11.71%
Algorand
The price of Algorand (ALGO) has dropped significantly, exceeding the previous low of December 31, 2022. On June 10, the altcoin fell to a low of $0.09, but the bulls struck. Algorand broke above the 21-day simple moving average, but is trapped between the moving average lines. ALGO is currently trading at $0.12 as we write this article.
According to the price indicator, ALGO will fall to the 2.0 Fibonacci extensions level or $0.070. If the price falls below the 21-day line SMA, the selling pressure will increase again. ALGO will fall back to its previous low of $0.09. If the previous trend is broken, the downtrend will resume. The Relative Strength Index for the 14 period is 43.
It ranks third among all performances. It has the following characteristics:
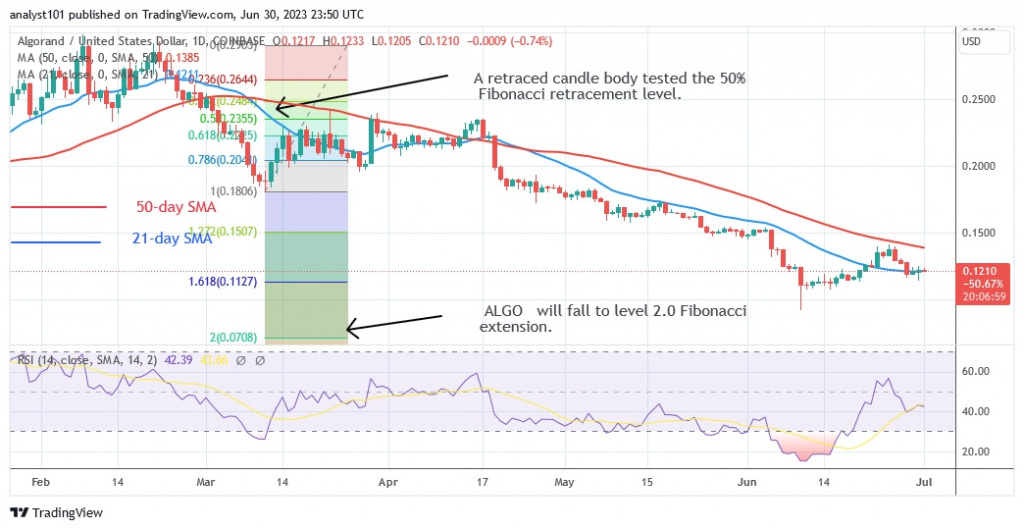
Current price: $0.1204
Market capitalization: $1,203,094,777
Trading volume: $54M
7–day loss: 9.88%
The Graph
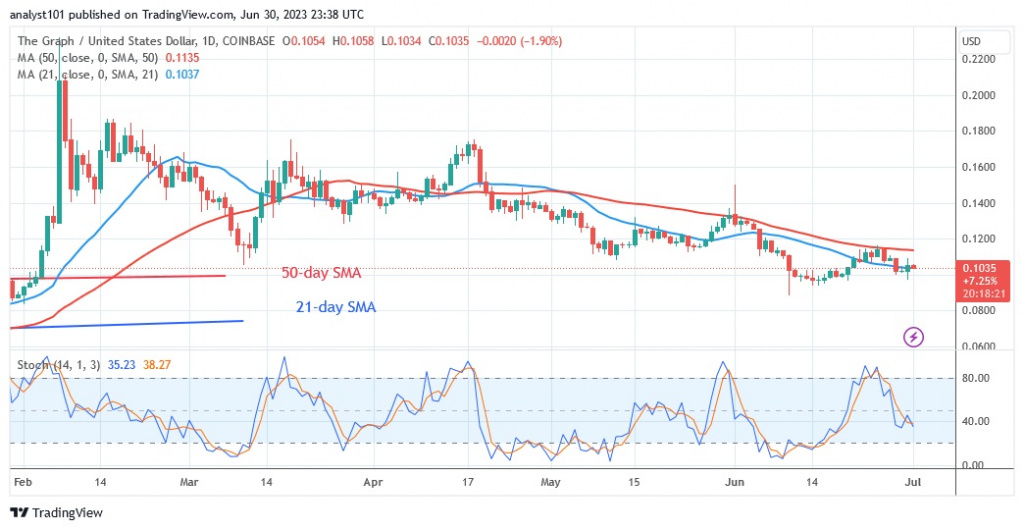
The price of Graph (GRT) falls below the moving average lines. After a failed rally on February 7, GRT was in a sideways trend during the last price action. GRT is currently trading at $0.10 as we write this article. The cryptocurrency has been caught between moving average lines. If the bears break below the 21-day line SMA, the cryptocurrency will fall even more.
GRT has negative momentum below the daily stochastic level of 50. It is currently the fourth worst cryptocurrency on the market.
Graph has the following features:
Current price: $0.1027
Market capitalization: $1,096,568,672
Trading volume: $43M
7–day loss: 7.54%
BitDAO
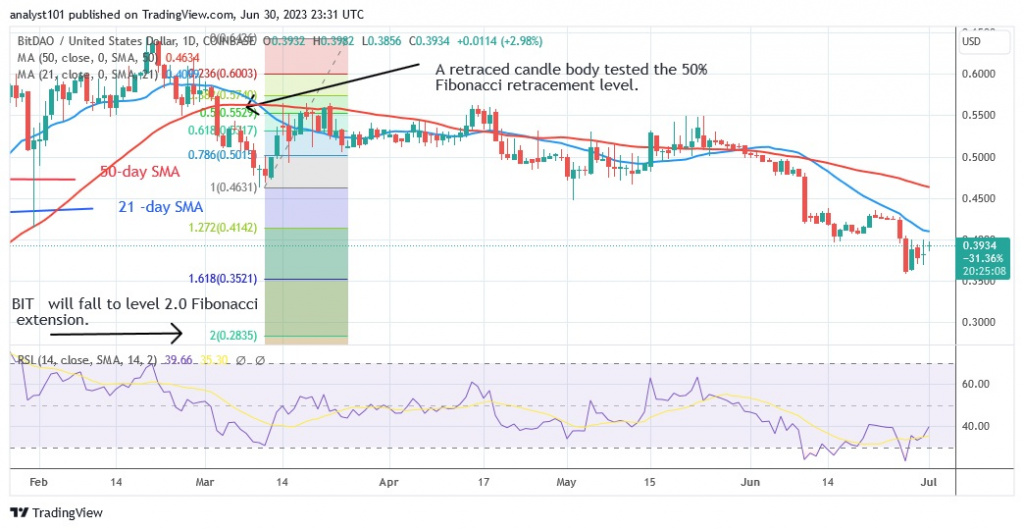
The price of BitDAO (BIT) is falling as it faces another rejection at the moving average lines. The price indicator predicts that BIT will fall to the level of the 2.0 Fibonacci extension or a low of $0.28. The altcoin is now rejected at the 21-day SMA line. If the BIT falls below its current support level of $0.35, it would retrace to its previous low of December 28, 2022.
For the period 14, the altcoin is at level 43 on the Relative Strength Index.
It has the following characteristics:
Trading volume: $21M
7–day loss: 7.34%
Check our weekly analysis of the altcoins that showed the best performance according to their price rise on Coinidol.com.
Disclaimer. This analysis and forecast are the personal opinions of the author and are not a recommendation to buy or sell cryptocurrency and should not be viewed as an endorsement by CoinIdol.com. Readers should do their own research before investing in funds.
Price
Price
Price
Price
Price

(0 comments)