Weekly Cryptocurrency Market Analysis: Bulls Overwhelm by Bears as Altcoins Battle Resistance Levels
Updated: Feb 01, 2022 at 12:58

Since the January 22 price collapse, most altcoins have reached the oversold regions of the market. Buyers have been unable to keep cryptocurrencies' prices above the overriding resistance levels. Consequently, these altcoins were forced to continue their downward correction.
Cosmos
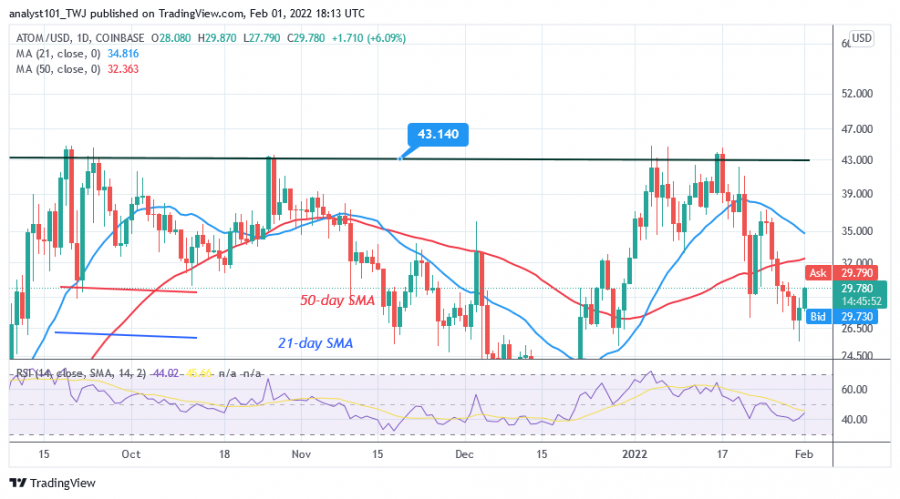
Cosmos (ATOM) is in a sideways trend. The cryptocurrency has been in a range-bound movement since September 19, 2021. The bulls have failed to overcome the overriding resistance at $43. Buyers have made several attempts to overcome the overriding resistance, but without success.
Today, Cosmos is rising again after falling below the moving averages. The cryptocurrency is the biggest loser of the past week. It has the following characteristics:
Price: $29.64
Market capitalization: $8,488,980,747
Trading volume: $1,061,509,432
7-day loss: 19.28%
Terra
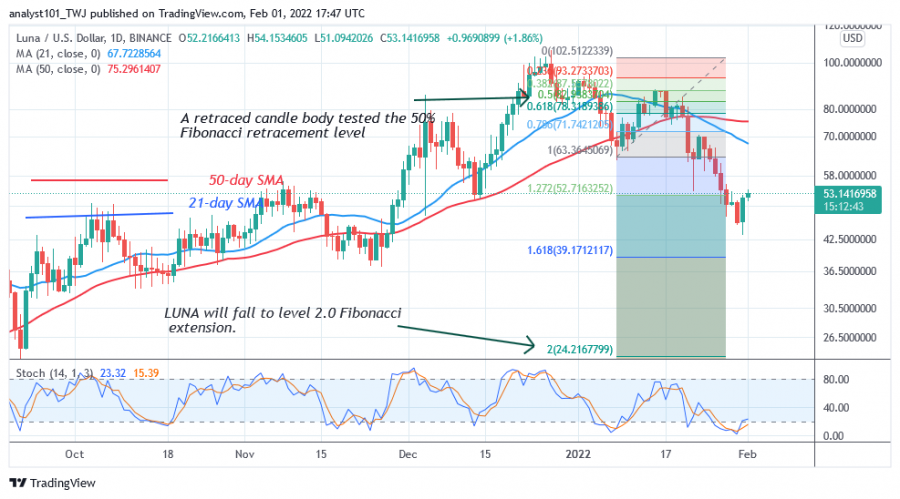
Terra (LUNA) is in a downtrend. On December 27, the cryptocurrency hit a high of $106 as the market reached an overbought region. Sellers emerged and pushed prices down. Today, LUNA has reached the low of $45 at the time of writing. However, it is likely that Terra will continue to fall.
Meanwhile, a candlestick tested the 50% Fibonacci retracement level on January 8. The retracement suggests that LUNA will fall to the 2.0 Fibonacci extension level or the $39.17 level. LUNA is the second biggest loser of the previous week. It has the following characteristics:
Price: $53.09
Market capitalization: $43,561,763,612
Trading volume: $2,582,926,468
7-day loss: 18.11%
Fantom
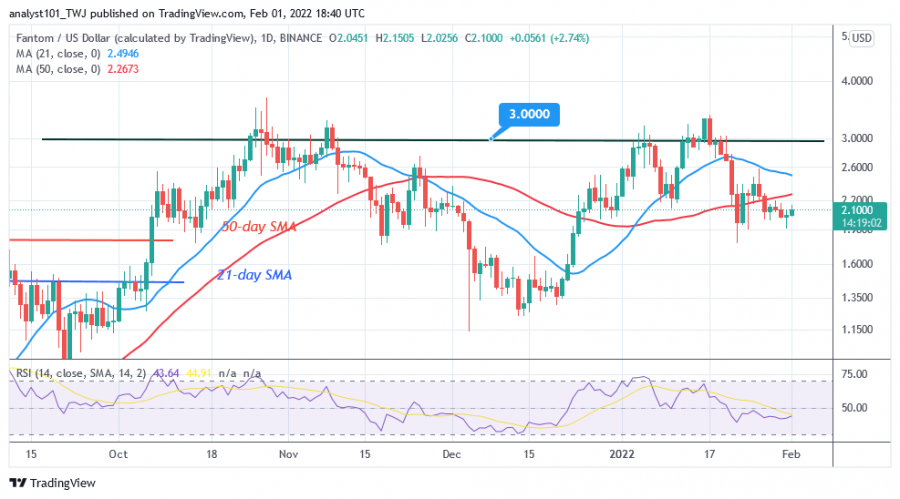
Fantom (FTM) is trading in a sideways trend. The cryptocurrency has been in a sideways trend since October 25. After reaching a peak price of $3,000, the bulls failed to break above the overhead resistance level.
Currently, the altcoin has fallen below the moving averages after being rejected at the overhead resistance. Altcoin is facing further declines as it is below the moving averages. Altcoin is the third biggest loser of the past week. The cryptocurrency asset has the following characteristics:
Price: $2.10
Market capitalization: $6,676,638,643
Trading volume: $905,042,075
7-day loss: 10.85%
XDC Network
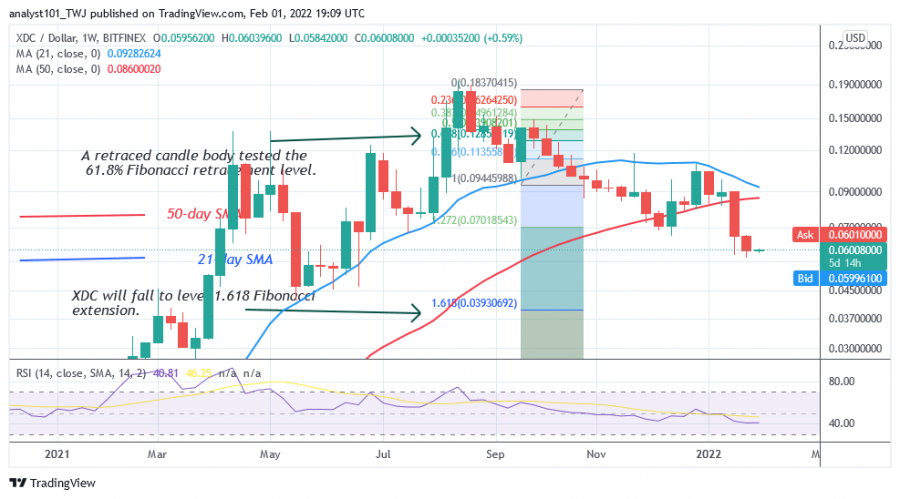
XDC Network (XDC) is in a downtrend. The cryptocurrency has dropped significantly. Since August 2021, the cryptocurrency has been in a downtrend and further downward movement is likely. Today, the altcoin fell from the high of $0.19 to a low of $0.056. XDC has fallen below the moving averages and may fall further.
In the downtrend from September 20, a candlestick tested the 61.8% Fibonacci retracement level. The retracement suggests that XDC will fall to the 1.618 Fibonacci Extension level or $0.039. The altcoin is the fourth biggest loser of the past week. It has the following characteristics:
Price: $0.06004
Market capitalization: $2,259,297,629
Trading volume: $8,001,971
7-day loss: 6.19%
Quant
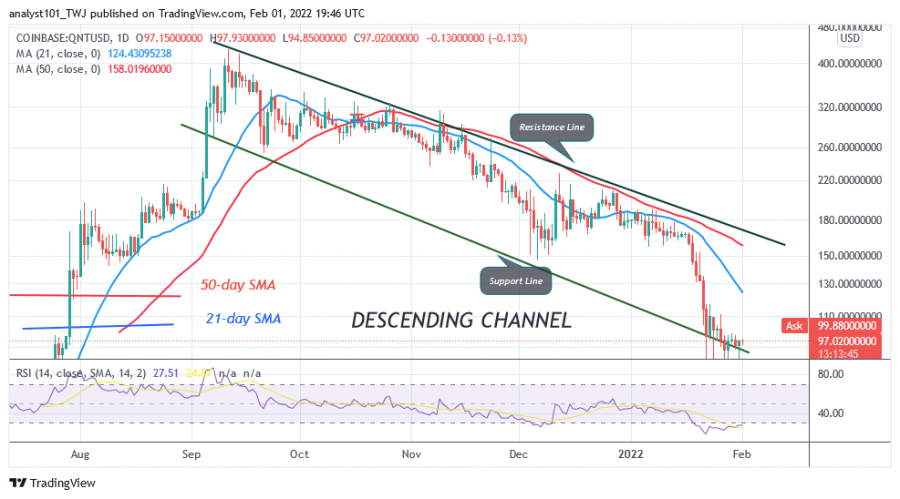
Quant (QNT) is in a downtrend and has also fallen sharply. The cryptocurrency has fallen from its high of $428 to a low of $83 at the time of writing. The altcoin has fallen into oversold territory in the market as bulls have bought the dips.
Today, the market is consolidating above current support for a possible upside move. Quant is the fifth biggest loser of the past week. It has the following characteristics:
Price: $96.95
Market capitalization: $1,416,678,622
Trading volume: $32,476,471
7-day loss: 4.63%
Disclaimer. This analysis and forecast are the personal opinions of the author and are not a recommendation to buy or sell cryptocurrency and should not be viewed as an endorsement by CoinIdol. Readers should do their own research before investing funds.
Price
Price
Price
Price
News

(0 comments)