Ripple Pauses Above $0.33 Support as Bears Resume Selling at $0.46 High

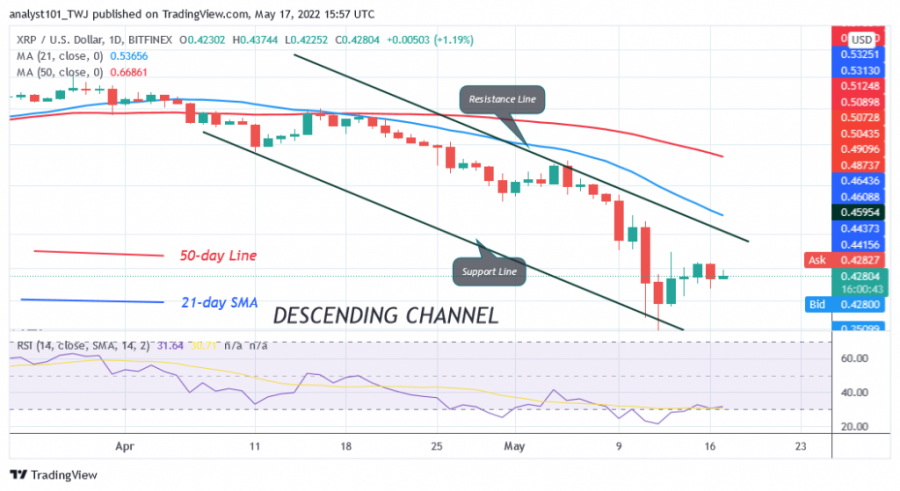
The price of Ripple (XRP) is in a downtrend as the cryptocurrency has fallen to the low of $0.33. The low of $0.33 is the historical price level from February 1, 2021.
Long-term forecast for Ripple (XRP) price: bearish
Today, XRP has risen to the high of $0.42 as the market resumes its upward correction. On May 13, the cryptocurrency price tried to rise above the current support. The altcoin reached the high of $0.46 and was pushed back. On May 15, Ripple also faced a similar rejection at the recent high. On the upside, bulls are finding it difficult to overcome the initial resistance at $0.47. The resistance at $0.47 is the previous support of the May 10 price drop. This is an indication that XRP/USD will retrace and regain the previous low at $0.33. On the downside, the downtrend will resume if the bears break below the support at $0.33. Later, the altcoin will fall to a low of $28.
Ripple (XRP) indicator analysis
Ripple is at the level 32 of the Relative Strength Index for the period 14. XRP is facing rejection at the recent high. Selling pressure will resume as XRP is trading in the downtrend zone. The altcoin is above the 25% range of the daily stochastic. The market was in a bullish momentum during the upward correction. Meanwhile, the 21-day line SMA and the 50-day line SMA are sloping south, indicating a downtrend.

Technical Indicators:
Key resistance levels - $0.80 and $1.00
Key support levels - $0.60 and $0.40
What is the next move for Ripple (XRP)?
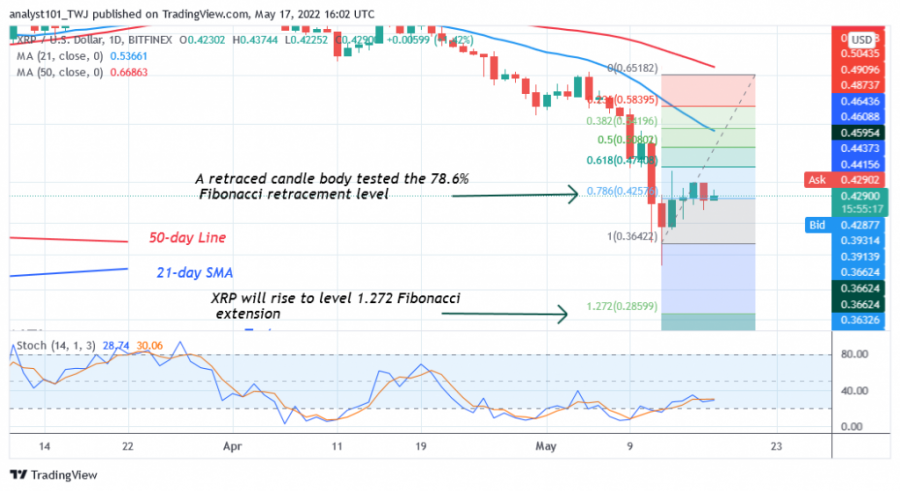
Ripple is preparing for another downward movement. The upward movement is hindered by the resistance at $0.47. Currently, XRP is moving below the $0.47 resistance zone. Meanwhile, the May 12 downtrend has shown a candlestick testing the 78.6% Fibonacci retracement level. The retracement suggests that XRP will fall to the 2.0 Fibonacci Extension level or $0.28. The price action shows that the market is fluctuating between $0.33 and $0.47.

Disclaimer. This analysis and forecast are the personal opinions of the author and are not a recommendation to buy or sell cryptocurrency and should not be viewed as an endorsement by CoinIdol. Readers should do their own research before investing
Coin expert
News
Price
Price
Price

(0 comments)