XRP Approaches The $0.50 Mark
Updated: Sep 18, 2023 at 14:55

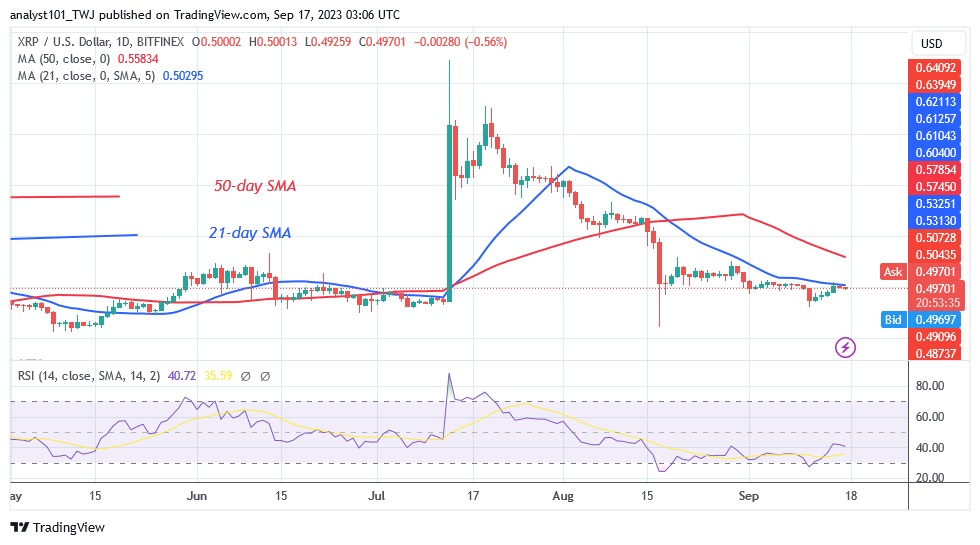
The latest price analysis by Coinidol.com report, XRP price is falling and approaching the previous low of August 17, however reaches $0.50 on September 18.
XRP price long-term forecast: bearish
On August 17, the altcoin fell to a low of $0.42 and then recovered. The upward correction was staved off twice at the $0.55 resistance level. On September 11, the bearish momentum reached a low of $0.45 as the bulls bought the dips.
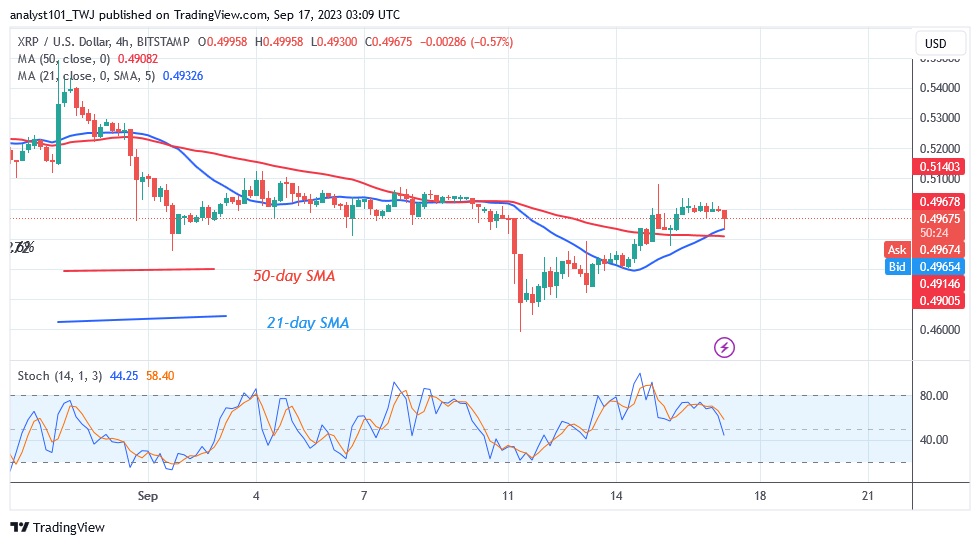
XRP is currently trapped at the 21-day line SMA. If the bulls break the 21-day line SMA, the cryptocurrency will advance to the 50-day line SMA. A break above the moving average lines indicates that the uptrend has resumed.
Now, on September 18, 2023, XRP price reached $0.505.
XRP indicator analysis
XRP is gradually falling and approaching the level of the Relative Strength Index 40 for the period 14. The moving average lines are above the price bars. The moving average lines act as price bar resistance. XRP was previously in the overbought zone. It is now in a downtrend below the Stochastic threshold of 40 on a daily basis.

Technical Indicators:
Key resistance levels – $0.80 and $1.00
Key support levels – $0.40 and $0.20
What is the next move for XRP?
The price of XRP is falling and the bears are trying to retest the previous low of $0.42. At the time of writing, XRP is trading at $0.49 - $0.50. The cryptocurrency value is falling as it faces resistance at the 21-day line SMA. Since September 11, XRP has traded in a narrow range between $0.45 and $0.50.

Last week Coinidol.com reported that the 21-day line SMA or the barrier at $0.51 has slowed down the upward movement. The doji candlesticks have slowed down the price movement.
Disclaimer. This analysis and forecast are the personal opinions of the author and are not a recommendation to buy or sell cryptocurrency and should not be viewed as an endorsement by CoinIdol.com. Readers should do their research before investing in funds.
Price
Price
Price
Price
News

(0 comments)