XRP Encounters Fierce Resistance In It Reaches $0.45
Updated: Oct 13, 2023 at 14:21

The price of Ripple (XRP) has continued to fall below its moving average lines.
Long-term forecast for the Ripple (XRP) price: bearish
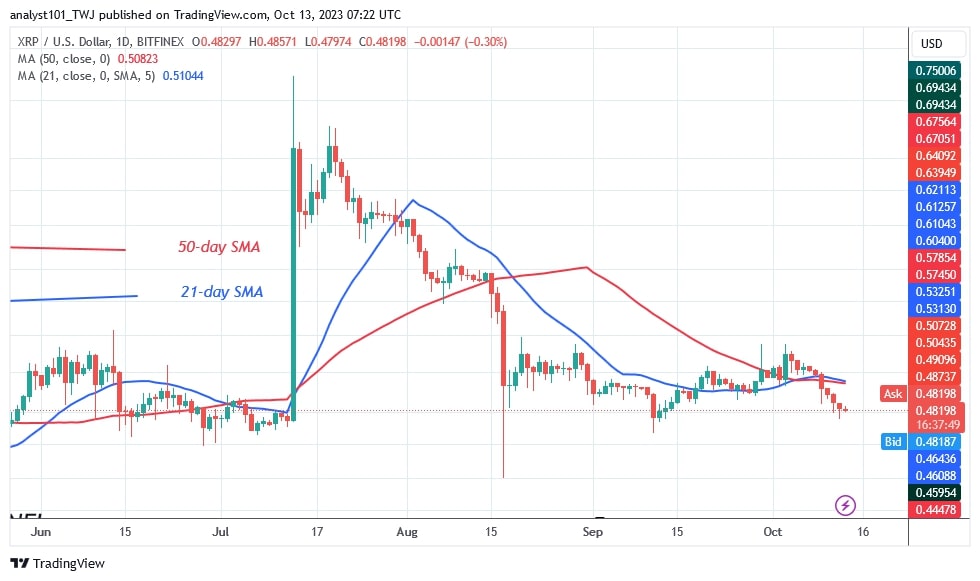
The price of Ripple has crashed after four unsuccessful attempts to break above the $0.55 resistance level.
At the time of publication, the XRP price had fallen as low as $0.48. The price is currently retesting the previous support level at $0.47 to continue the downtrend.
The current support level has held since September 11. On the negative side, XRP could fall even lower to the low of $0.45 if the bears break the existing support. The presence of doji candlesticks has currently restricted price movement. The altcoin is currently bouncing off the $0.47 support.
XRP Indicator Analysis
Price bars that used to be above the moving average lines are now below them, indicating that the cryptocurrency is bearish. The altcoin tries to rise when the price bar is above the moving average lines, but was thwarted by the overriding resistance of $0.55. The horizontal slope of the moving average lines indicates that the altcoin has been trading sideways.

Technical Indicators:
Key resistance levels – $0.80 and $1.00
Key support levels – $0.40 and $0.20
What is the next move for XRP?
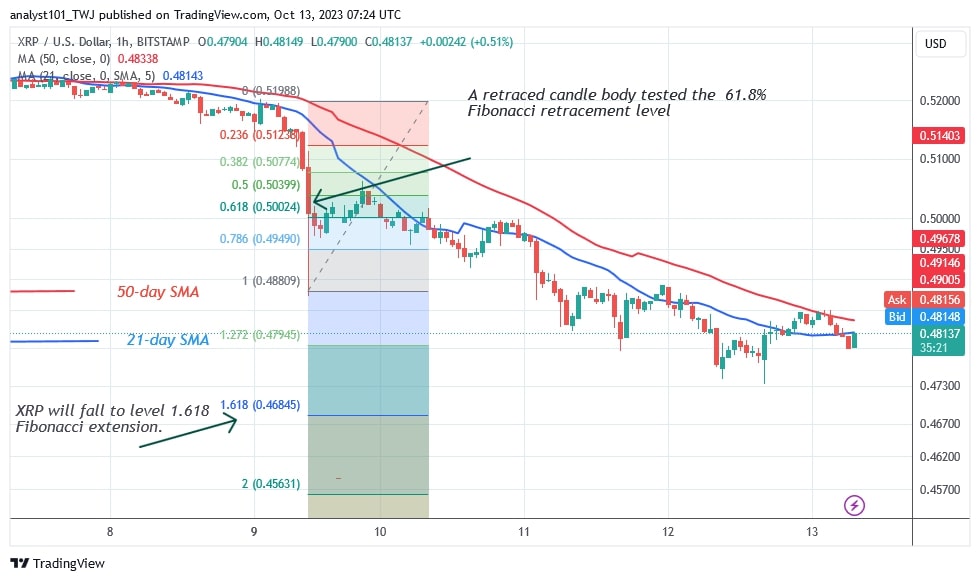
XRP is falling below the moving average lines on the 4-hour chart. The upward correction is denied at the high of $0.4850. This means that the downtrend continues. However, the price indication suggests that the cryptocurrency will continue to fall. The altcoin is expected to rise to the 1.618 level of the Fibonacci extension or to the $0.46 level.

On October 6, Coinidol.com reported that the price of the Ripple coin was at $0.51. The bulls desperately tried to resume the uptrend last week, but were rebuffed.
Disclaimer. This analysis and forecast are the personal opinions of the author and are not a recommendation to buy or sell cryptocurrency and should not be viewed as an endorsement by CoinIdol.com. Readers should do their research before investing in funds.
Price
News
Price
Price
Price

(0 comments)