XRP Drifts Sideways And Stops Its Slide Above $0.48
Updated: Sep 12, 2024 at 12:02

The price of Ripple coin (XRP) is bearish as it continues to drift sideways below the moving average lines.
XRP long-term analysis: fluctuating
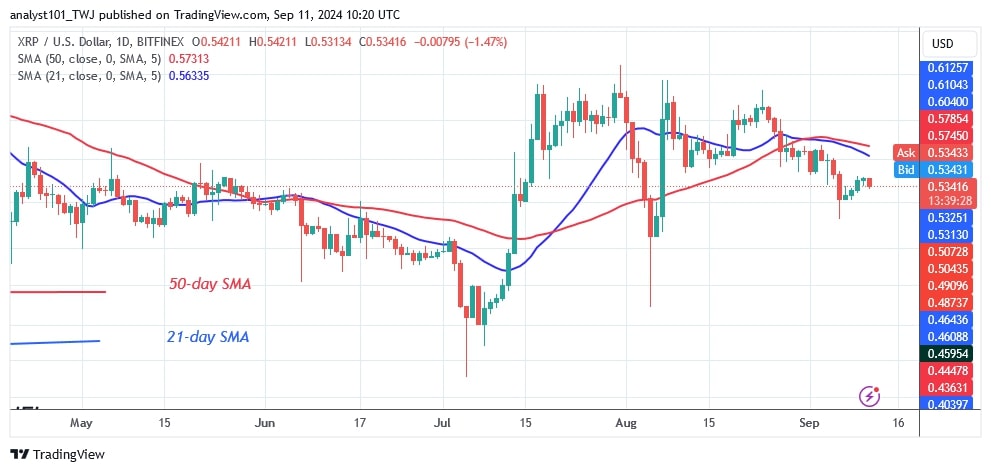
Since August 5, as reported by Coinidol.com, the cryptocurrency has traded in a range of $0.43 to $0.64.
On September 6, the altcoin fell below the moving average lines and reached a low of $0.50. The bulls halted the decline and initiated an upward correction. The altcoin's upward move was met with resistance and it is now heading down.
On the downside, XRP will return to its previous low of $0.43 if it retraces and breaks the existing support. The altcoin will move in a narrow range below the moving averages if the current support level holds. At the moment, the coin is worth $0.52.
XRP indicator analysis
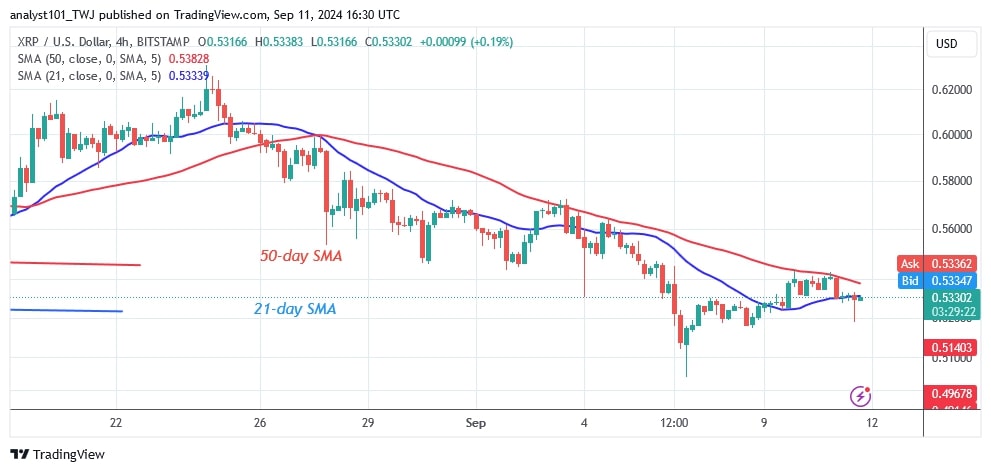
On the 4-hour chart, the price bars are between the moving average lines, indicating a few days of range-bound trading. The sideways trend causes the moving average lines to run horizontally. The price bars have remained stable due to the doji candlesticks.
Technical indicators:
Resistance Levels – $0.80 and $1.00
Support Levels – $0.40 and $0.20

What is the next direction for XRP?
XRP is trading sideways between $0.43 and $0.64. The altcoin is falling as it approaches the lower price level of $0.43. Should the bears break the current support at $0.43, the market would fall to its previous low of $0.41. XRP will continue to trade in a range between $0.43 and below the moving average lines if the current support holds.

Disclaimer. This analysis and forecast are the personal opinions of the author. They are not a recommendation to buy or sell cryptocurrency and should not be viewed as an endorsement by CoinIdol.com. Readers should do their research before investing in funds.
Price
Price
Price
Price
News

(0 comments)