Ripple In a Sideways Move as Bulls Regain Support Above $1.05
Updated: Aug 27, 2021 at 09:59

The price of Ripple (XRP) has fallen to the low of $1.08 after several days of range-bound movement.
Ripple (XRP) Price Long-Term Forecast: Bullish
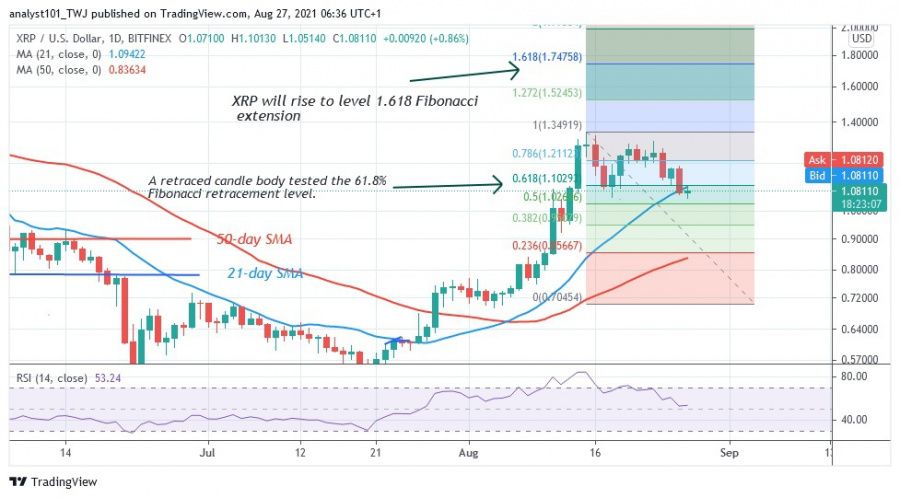
Today, the XRP price fell above the 21-day pair SMA with the appearance of a bullish candle. This is an indication of a possible upward movement of the altcoin. Ripple earlier reached a price of $1.34, which dropped to $1.08. If the 21-day support SMA holds, buyers are likely to push the crypto to the previous price level.
According to the price indicator, the market will rise above the previous price level if the current resistance is broken. Meanwhile, on August 15 uptrend; a retraced candle body tested the 61.8% Fibonacci retracement level. The retracement suggests that XRP will rise to the level of 1.618 Fibonacci extension or the level of $1.74. This bullish scenario is likely once resistance at $1.30 is broken.
Ripple Indicator Analysis
Ripple is at level 53 of the Relative Strength Index of period 14. It is in the uptrend zone and above the midline 50. It indicates that XRP can rise to the upside. The selling pressure will continue if the price breaks below the SMAs and it is persistent. XRP has fallen into the oversold area of the market. The implication is that selling pressure has eased as buyers are expected in the oversold region.

Technical Indicators:
Major Resistance Levels - $1.95 and $2.0
Major Support Levels - $0.80 and $0.60
What is the next move for Ripple (XRP)?
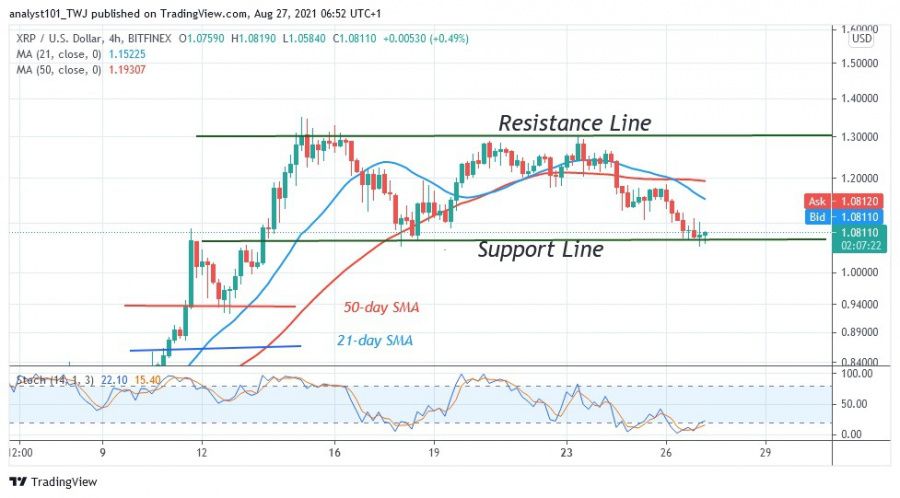
According to the 4-hour chart, Ripple is in a range-bound move between the $1.05 and $1.30 levels. The range-bound move will continue as long as the price levels remain unbroken. Buyers have resumed the upside move to retest resistance at $1.30. A break above the recent high will signal the resumption of the uptrend.

Disclaimer. This analysis and forecast are the personal opinions of the author are not a recommendation to buy or sell cryptocurrency and should not be viewed as an endorsement by CoinIdol. Readers should do their own research before investing
News
Price
News
Price
Price

(0 comments)