XRP Exceeds $0.50 And The Bulls Continue Their Ascent

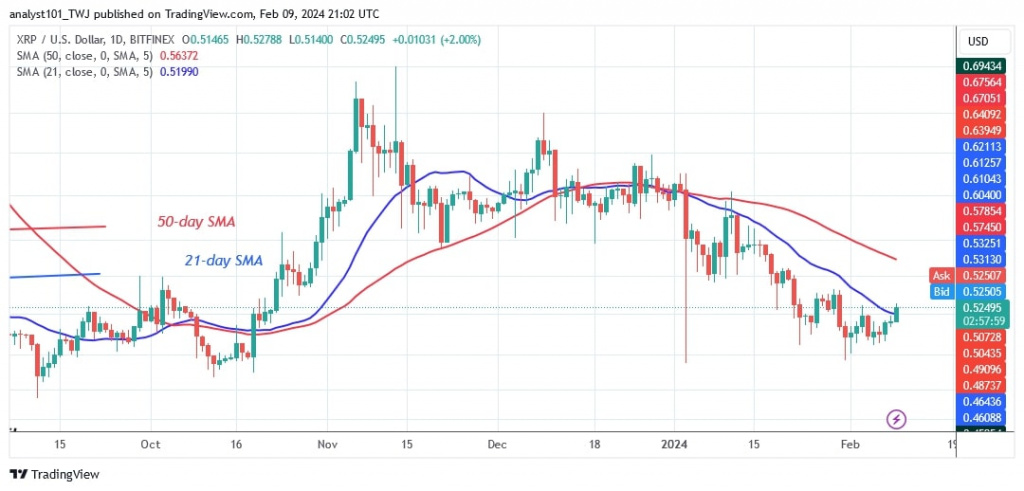
Coinidol.com's price analysis of the Ripple (XRP) coin price has fallen below the moving average lines, although it has broken above the 21-day SMA.
Long-term forecast for XRP price: bearish
In previous price action, XRP has fallen above the $0.50 support but below the moving average lines. Had the buyers lost the $0.50 support, the cryptocurrency might have dropped even lower to $0.46.
Today, the bears are losing control as buyers push the price above the 21-day SMA. The altcoin is currently worth $0.52. If the bullish momentum continues, the altcoin will rise to the 50-day simple moving average or the $0.56 high. The uptrend will start when the price breaks above the moving average lines. The altcoin will reach a high of $0.67. The cryptocurrency value will be trapped between the moving average lines if the bullish momentum does not rise above the 50-day SMA.
XRP indicator analysis
After the recent price rally, the price bars are above the 21-day SMA but below the 50-day SMA. This will cause the cryptocurrency to oscillate between the moving average lines. Despite the recent price rise, the sloping moving average lines remain downward sloping.
Technical indicators:
Key resistance levels – $0.80 and $1.00
Key support levels – $0.40 and $0.20

What's next for XRP?
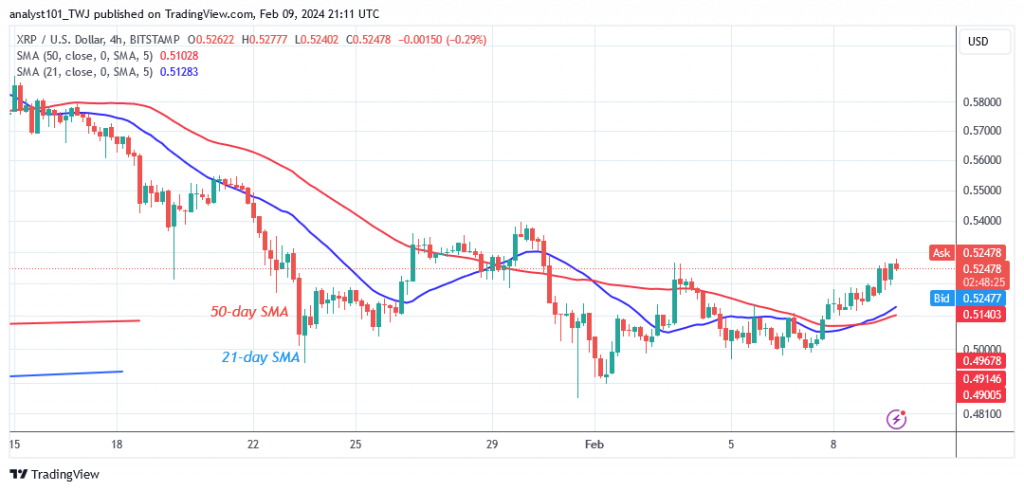
On the 4-hour chart, XRP has resumed its bullish momentum by crossing above the 21-day moving average line. The altcoin is growing as it approaches the high of $0.5350. Buyers were rejected on January 26, 2024 as they tried to hold the price above the $0.5350 peak. The altcoin is currently in a trap that is preventing it from moving higher.

Disclaimer. This analysis and forecast are the personal opinions of the author and are not a recommendation to buy or sell cryptocurrency and should not be viewed as an endorsement by CoinIdol.com. Readers should do their research before investing in funds.
Price
News
Price
Price
News

(0 comments)