Uniswap Trades in a Narrow Range and Challenges the High at $7.00

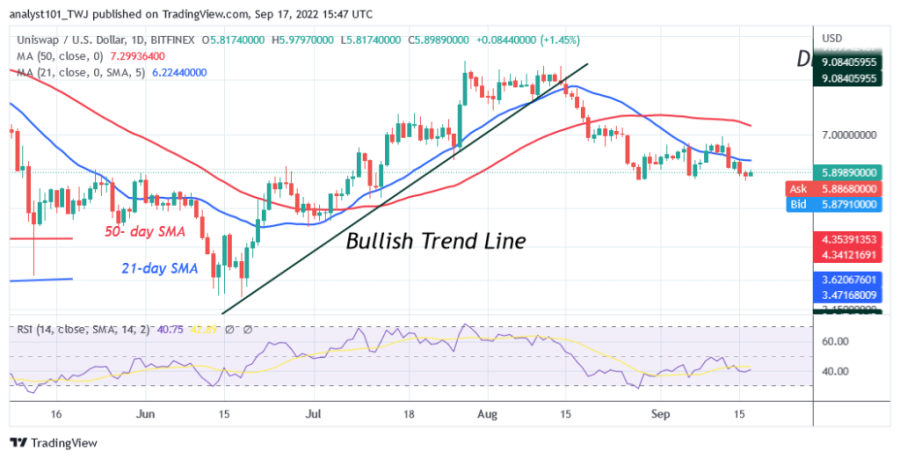
Uniswap (UNI) price is in a downtrend, falling to the low of $5.81. Selling pressure has eased as the altcoin continues to consolidate above the $5.71 support.
Uniswap price long-term analysis: bearish
Since August 28, the cryptocurrency has been trading in a narrow range between $5.71 and $7.00. To the upside, the upside moves are limited by the 50-day line SMA or the resistance at $7.00.
For example, buyers broke through the 21-day line SMA on September 6 and 12, but were rebuffed from the recent high. Further upside is doubtful. However, if UNI rallies, resistance at $7.00 or the 50-day line SMA will be broken. The altcoin will rise and retarget the overhead resistance at $9.80. UNI is trading below the 21-day line SMA. On the downside, UNI may face renewed selling pressure if it turns down from the 21-day line SMA.
Uniswap indicator analysis
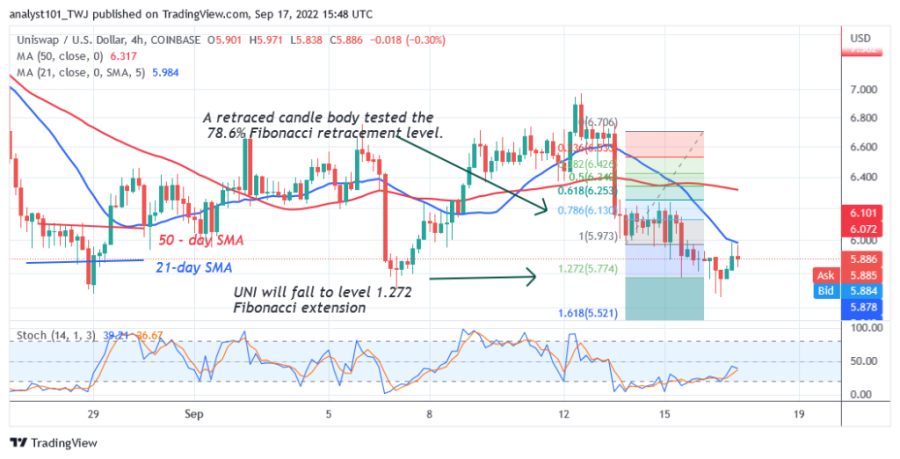
The Uniswap indicator is at the 40 level of the Relative Strength Index for the 14 period. It indicates that UNI is still in a downtrend and may continue to decline. The price of the cryptocurrency is below the moving average lines, which indicates a further decline. UNI is above the 40% area of the daily stochastic. This indicates that the market is in a bullish momentum, but it has subsided.

Technical Indicators
Key resistance zones: $12.00, $14.00, $16.00
Key support zones: $10.00, $8.00, $6.00
What is the next direction for Uniswap?
Uniswap is in a downtrend as it falls below the moving average line. The current selling pressure has eased as it has reached the oversold area of the market. Meanwhile, on September 14 downtrend. a retreated candle body tested the 78.6% Fibonacci retracement level. The retracement suggests that UNI will rise to the level of the Fibonacci extension of 1.272 or to the level of $ 5.77.

Disclaimer. This analysis and forecast are the personal opinions of the author and are not a recommendation to buy or sell cryptocurrency and should not be viewed as an endorsement by CoinIdol. Readers should do their research before investing in funds.
Price
Price
News
Price
Price

(0 comments)