Dogecoin Price Oscillates On Its Way Above $0.13
Dogecoin (DOGE) price has rallied, but the upside correction has been delayed twice by resistance at $0.13
Dogecoin price long term forecast: bullish
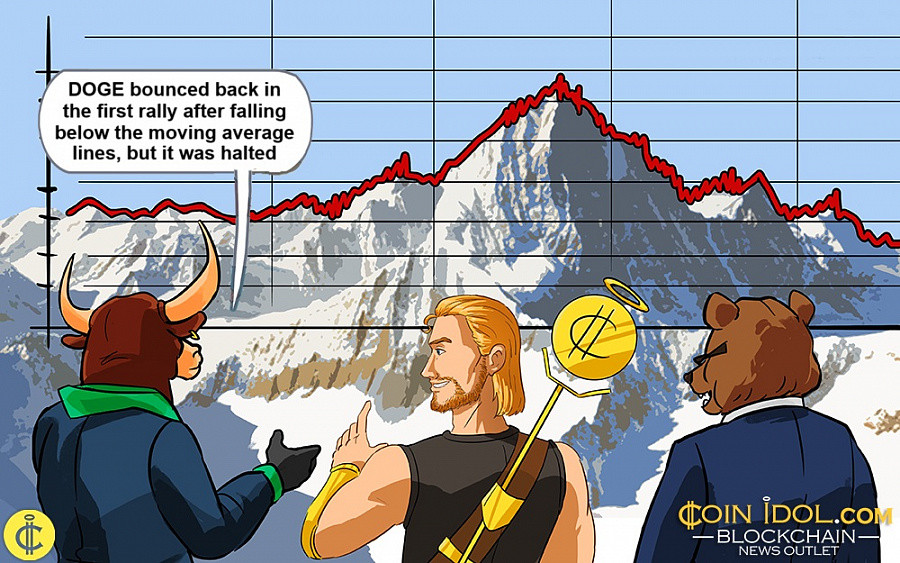
DOGE bounced back in the first rally after falling below the moving average lines, but it was halted by the 50-day SMA. The price of the cryptocurrency rose above the 21-day SMA as buyers rallied above the 50-day moving average line.
The second rally has reached the resistance level but is fluctuating below it. Meanwhile, DOGE is trading sideways above the moving average lines but below the resistance at $0.13. If the initial barrier is broken, DOGE will rise above $0.14. The positive momentum will continue to the high of $0.17. Today, DOGE is trading at $0.123.
DOGE indicator reading
The price bars on both charts are above the moving average lines, indicating that the altcoin will continue to rise. The moving average lines cross in a bullish manner when the altcoin starts to rise. The moving average lines are trending upwards as the market predicts an uptrend.
Technical indicators
Resistance Levels $0.22 and $0.24
Support Levels – $0.14 and $0.12
 – OCT. 17, 2024")
What is the next direction for Dogecoin?
DOGE is trading sideways on the 4-hour chart, with prices ranging between $0.10 and $0.13. Buyers pushed the altcoin to a high of $0.13, but it failed to surpass the current high. DOGE has retreated but remains above the 21-day SMA support. The altcoin's rise will begin if the price breaks above the $0.13 resistance level.
Otherwise, the sideways trend will continue.
 – Oct.17, 2024")
Disclaimer. This analysis and forecast are the personal opinions of the author. They are not a recommendation to buy or sell cryptocurrency and should not be viewed as an endorsement by CoinIdol.com. Readers should do their research before investing in funds.
Coin expert
Price
News
Price
News

(0 comments)