TRON Finds Support Above $0.153 Despite Slide
Updated: Oct 07, 2024 at 12:07

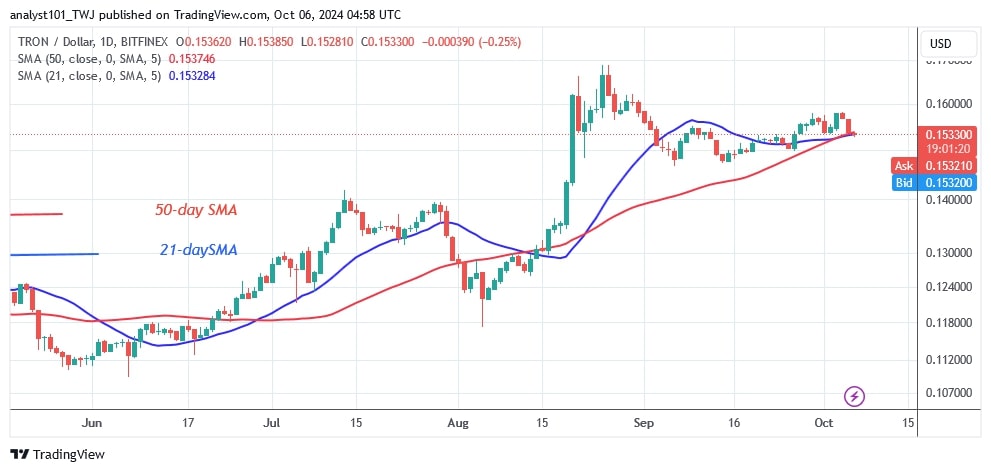
TRON (TRX) is now trading in a narrow range of $0.145 to $0.16. The price movement is limited to the current range as it has retraced above the moving average lines.
The price of TRON is in a sideways trend after the end of the upward trend on August 25, as reported by Coinidol.com before. Over the past month, the cryptocurrency has traded above the support level of $0.145 but below the resistance level of $0.17. Buyers tried to hold the price above $0.17 but were rebuffed.
TRX price long-term forecast: ranging
TRX will fall to a low of $0.139 if the bears break the moving average lines. However, the altcoin's trend will continue if it finds support above the moving average lines.
TRX indicator analysis
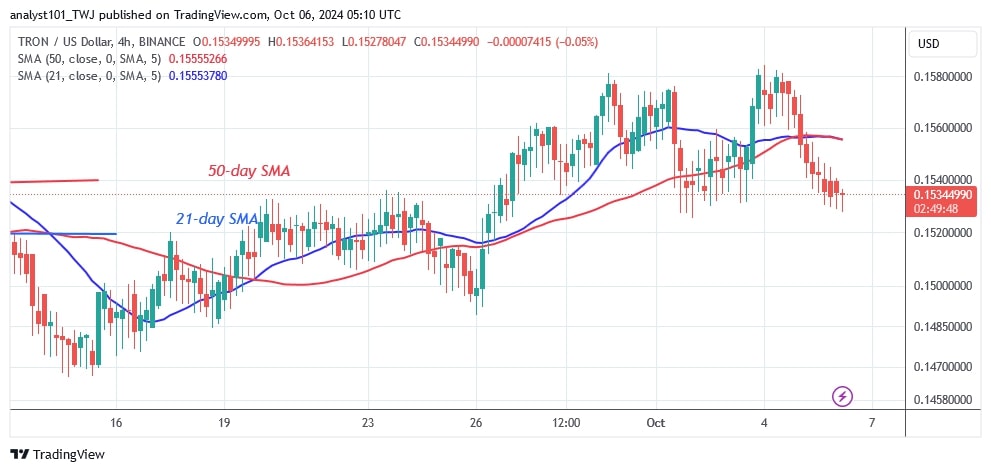
The moving average lines are sloping horizontally, indicating a sideways trend. The price bars are moving both below and above the 21-day SMA. TRX will fall further if the price bars on the 4-hour chart fall below the moving average lines. The price movement is currently limited by doji candlesticks.
Technical Indicators
Key Resistance Zones: $0.13, $0.14, and $0.15
Key Support Zones: $0.10, $0.09, and $0.08

What is the next step for TRON?
TRON is trading sideways below the $0.158 mark. The altcoin's price range is $0.152 to $0.158. Buyers have tested the $0.158 mark three times, but have been unable to sustain the bullish momentum above this level.
On the downside, TRON is threatening to drop to a low above the $0.139 support.

Disclaimer. This analysis and forecast are the personal opinions of the author. They are not a recommendation to buy or sell cryptocurrency and should not be viewed as an endorsement by CoinIdol.com. Readers should do their research before investing in funds.
Price
Price
Price
Price
Price

(0 comments)