Solana Is In A Range And Threatens To Drop Above $171
Updated: Dec 16, 2024 at 09:01

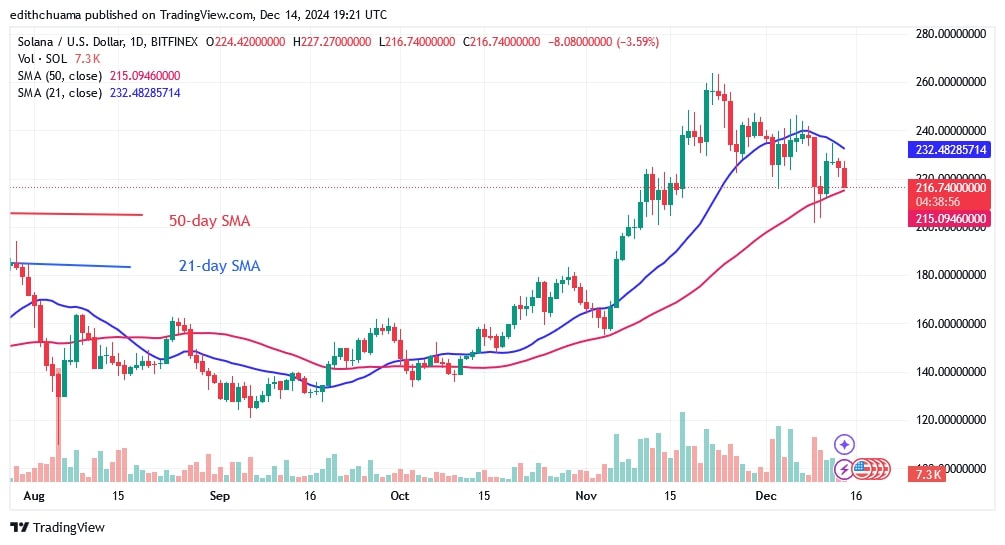
The price of Solana (SOL) has fallen between the moving average lines since December 2nd. Latest price analysis by Coinidol.com.
Long-term forecast for the Solana price: bearish
The price of Solana has been trapped within the moving average lines over the past week. In terms of price possession, neither the bulls nor the bears have a clear advantage. The bulls failed to push the price above the resistance at $240 and the 21-day SMA.
The bears pushed the price below the 5-day SMA, but the bulls bought the dips. Currently, the price is between the moving average lines. Once the moving average lines align, Solana will develop a trend. However, based on the price indication, Solana will drop below the 50-day SMA and to a bottom above $171.
Solana price indicator analysis
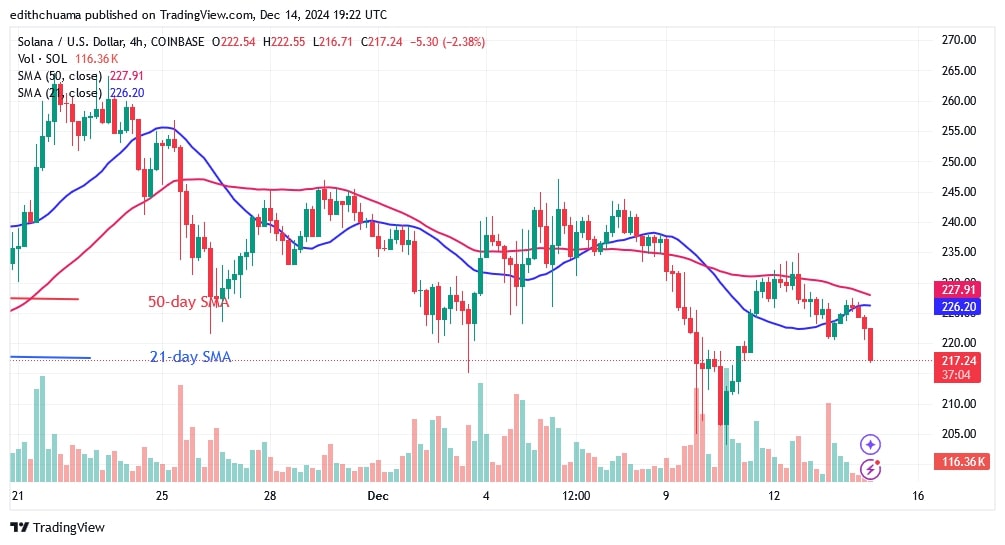
Solana has been trading between the moving average lines for more than a week. Neither the bulls nor the bears have been able to break through the moving average lines. Interestingly, the altcoin will move when the moving average lines are broken. A long candlestick tail signals strong buying pressure at lower price levels. The 4-hour chart shows that the moving average is sloping downwards, indicating a decline.
Technical indicators
Key supply zones: $220, $240, $260
Key demand zones: $140, $120, $100

What is the next move for Solana?
Solana has continued its downtrend. The price of the cryptocurrency is forming a series of lower highs and lower lows. Currently, the decline has stalled and the altcoin has initiated a move between $205 and resistance at $230. The uptrend will start when the price rises above the moving average lines and resistance at $240.

Disclaimer. This analysis and forecast are the personal opinions of the author. They are not a recommendation to buy or sell cryptocurrency and should not be viewed as an endorsement by CoinIdol.com. Readers should do their research before investing in funds.
News
Price
Price
News
Price

(0 comments)