Ripple on the Verge of another Breakdown as $0.23 Support Is Under Threat

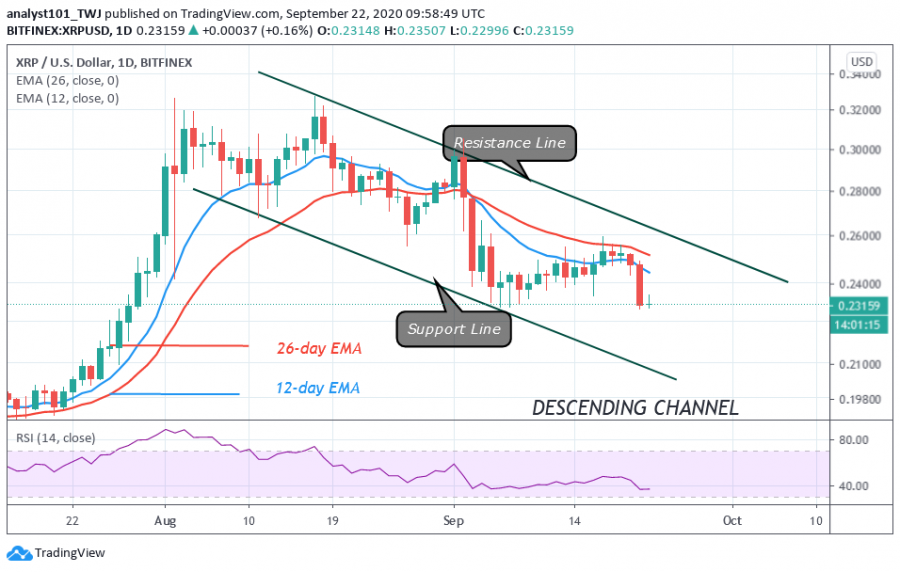
In the last 24 hours, sellers were unable to break below the $0.23 support.
On September 5, the bears were also repelled as the altcoin was compelled to a range-bound movement between $0.23 and $0.26. The bottom line is that the price level is a critical support level that will accelerate a downward movement of prices if it is breached.
In the same vein, a strong bounce above it will gear up the price above the $0.26 high. The trend will change if buyers push the price above the $0.26 high. Today, XRP is trading at $0.23123 at the time of writing. Meanwhile, the price action is showing a bearish signal above the current support. On the downside, if the sellers penetrate or break below $0.23 support, XRP will drop to either $0.21 or $0.19.
Ripple Indicator Analysis
The price bars are below the 12-day and 26-day EMAs. This suggests a possible downward movement of prices. The Relative Strength Index period 14 is indicating that Ripple is at level 36 and approaching the oversold region of the market. It also indicates the coin is in the downtrend zone and below the centerline 50.

Key Resistance Zones: $0.35, $0.40, $0.45
Key Support Zones: $0.25, $0.20, $0.15
What Is the Next Move for Ripple ?
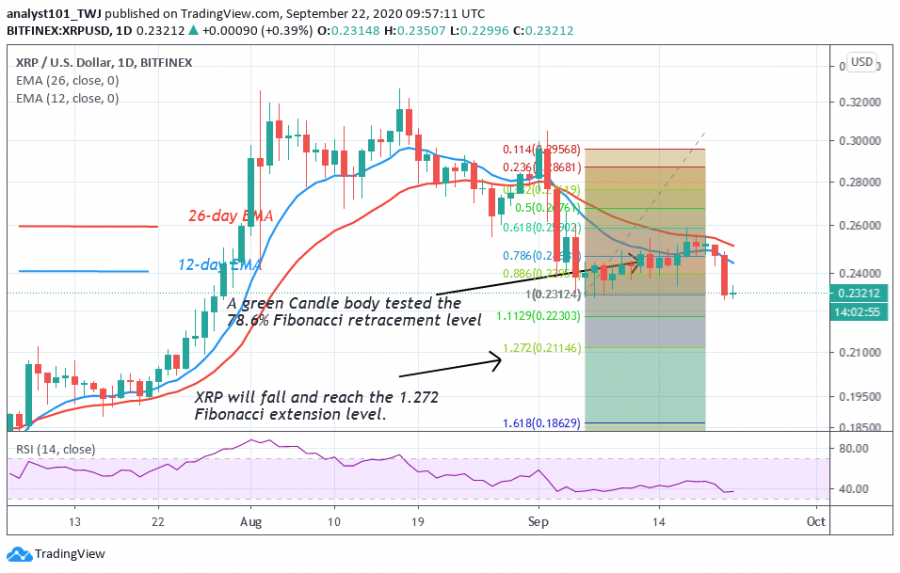
Ripple will escape a further downward move if buyers defend the $0.23 support. On the other hand, XRP will fall again if the current support cracks. According to the Fibonacci tool, the retraced candle body tested the 78.6 % Fibonacci retracement level on September 12. This indicates a possible downward move to 1.272 Fibonacci extension level or $0.21 low.

Disclaimer. This analysis and forecast are the personal opinions of the author and not a recommendation to buy or sell cryptocurrency and should not be viewed as an endorsement by CoinIdol. Readers should do their own research before investing funds.
Coin expert
Price
Price
Coin expert
Price


(0 comments)