Ripple Rebounds Above $0.76 Support, Shows no Strength Above $0.90 Resistance

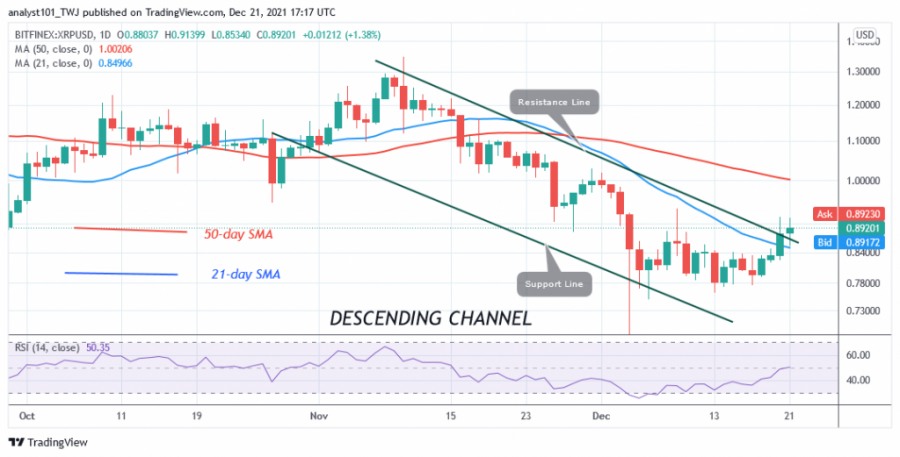
The price of Ripple (XRP) has rallied above key support at $0.76. This support has been held since August 8. The current rally indicates a possible uptrend for the cryptocurrency.
The bulls have broken above the 21-day moving average. A break above the 50-day moving average would signal the resumption of the uptrend. Buyers also need to break above resistance at $1.10 to get out of the downward correction. Currently, the upside move has reached a high at $0.89. XRP needs to rally above the resistance at $1.10 to resume the upward momentum.
Ripple indicator analysis
The recent bounce has led XRP to reach the 50 level of the Relative Strength Index for period 14. This indicates that there is a balance between supply and demand. The price of the cryptocurrency is above the moving average of the 21-day line. The XRP price accelerates when the price bars are above the two moving averages. XRP/USD is above the 60% area of the daily stochastic. The market has resumed its bullish momentum.

Technical indicators:
Major Resistance Levels - $1.95 and $2.0
Major Support Levels - $0.80 and $0.60
What is the next move for Ripple?
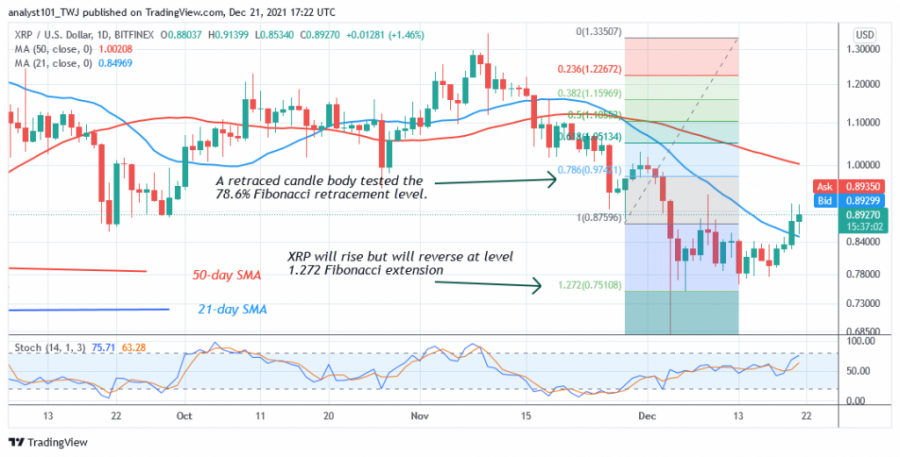
Ripple was previously in a downtrend but fell and has consolidated above support at $0.76. Today, the cryptocurrency has rallied back above the current support. Meanwhile, the downtrend from November 28 has shown a candle body testing the 78.6% Fibonacci retracement level. The retracement suggests that XRP will fall but reverse at the 1.272 Fibonacci level or $0.75.

Disclaimer. This analysis and forecast are the personal opinions of the author and are not a recommendation to buy or sell cryptocurrency and should not be viewed as an endorsement by CoinIdol. Readers should do their own research before investing.
Price
Price
Price
Price
Price

(0 comments)