Ripple Price Nosedives after Failing to Sustain Above the $0.30 Resistance Level

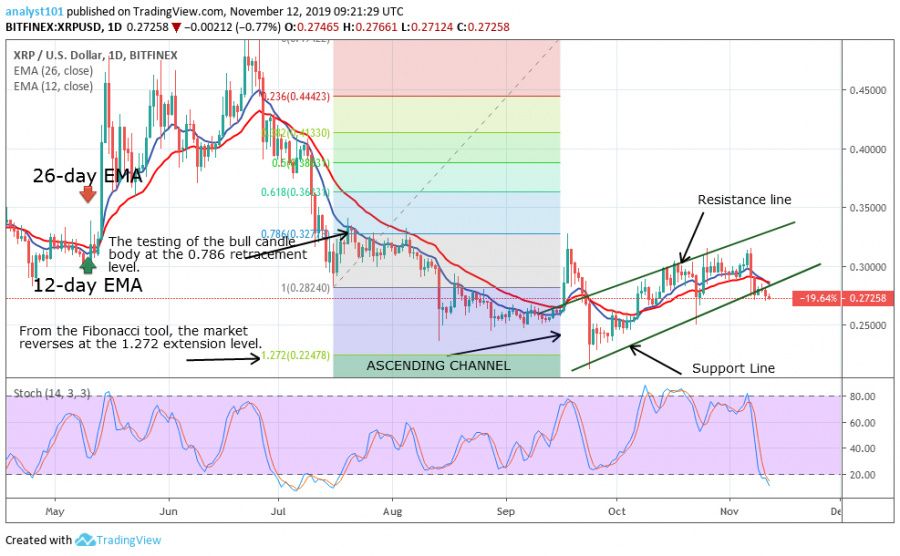
In November 2019, Ripple (XRP) has maintained a stable price level as it trades in a sideways trend. The market has been trading below the $0.30 resistance level as the bulls fail to break the price level. When the price tests the $0.30 resistance level, XRP will fall to a low at $0.29 support level and resume another bullish move.
Nevertheless, at other times, the market will fall to a low of $0.27 price level. It appears there is a lot of selling pressure at $0.30. However, if the downward movement continues at $0.27, the coin will further depreciate to a low of $0.24.
Ripple (XRP) Indicator Analysis
The ascending horizontal channel determines the direction of price. The Ripple coin will further depreciate if the support line is breached. Nonetheless, if the support holds, the coin will continue its bullish movement. Likewise, a break at the upper line of the channel will push XRP to rise. Presently, Ripple is approaching the oversold region below the stochastic. It indicates that the market is in a bearish momentum.

Key Supply Zones: $0.35, $0.40, $0.45
Key Demand zones: $0.25, $0.20, $0.15
What Is the Next Direction for Ripple (XRP)?
In a nutshell, Ripple is in a bullish trend. This has been confirmed by the indicators. From the daily chart, the market will fall and reverse at the 1.272 extensions. Ripple is in an upward move but lacks buying power at the support level. This has continued to compel the coin to move sideways after being resisted. The market will move up if buyers come in at the support level.
Disclaimer. This analysis and forecast are the personal opinions of the author are not a recommendation to buy or sell cryptocurrency and should not be viewed as an endorsement by CoinIdol. Readers should do their own research before investing funds.
Price
Price
Price
Price
Price

(0 comments)