Ripple Moves Sideways And Reaches The Range-Bound Zone

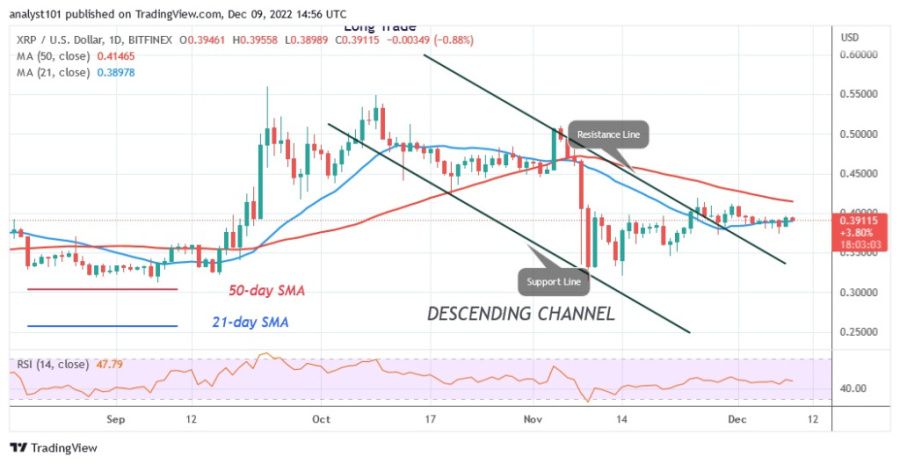
The price of Ripple (XRP) is continuously falling and the price trend has not changed. XRP is moving above the 21-day line SMA but below the 50-day line SMA. Similarly, the price of XRP is moving between the levels $0.31 and $0.40.
Ripple price long-term forecasts: bearish
Ripple is currently moving inside and outside the moving average lines. XRP will rise above the 50-day line SMA if buyers can break above the $0.40 level. If the positive momentum remains above the 50-day line SMA, the upward momentum of the Ripple asset will resume. XRP will reach a high at $0.50. On the other hand, if sellers cross the 21-day line SMA, XRP will retrace and resume its movement between $0.31 and $0.40. Today, XRP is hovering around the support at $0.39.
Ripple indicator analysis
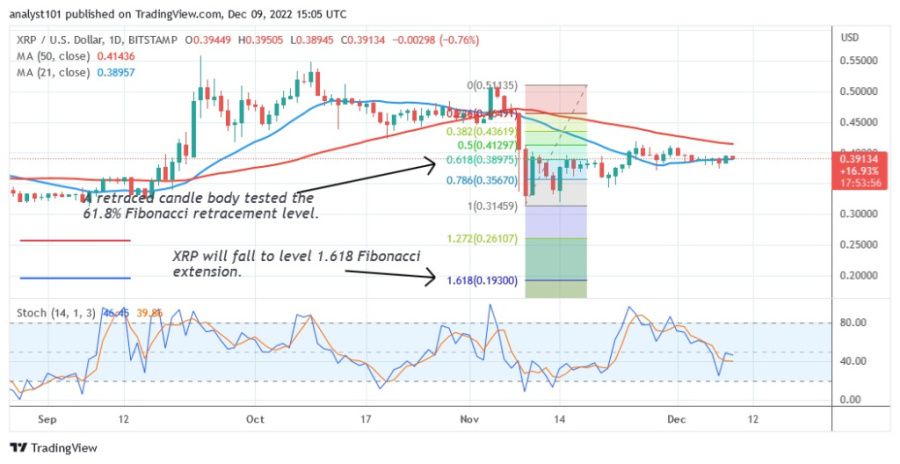
With a Relative Strength Index reading of 48 for the 14 period, Ripple is trading in the bearish zone. Although the price bars are above the 21-day moving average line SMA, they are between the moving average lines. There is a chance of a sideways movement. The daily stochastic for Ripple is above the 40 level and is in a bullish momentum.

Technical indicators
Key resistance levels - $0.80 and $1.00
Key support levels - $0.40 and $0.20
What is the next move for Ripple?
The price of Ripple(XRP) is moving sideways as it crosses the 21-day line SMA. However, if selling pressure picks up and Ripple breaks the $0.31 support level, it could fall.

Disclaimer. This analysis and forecast are the personal opinions of the author and are not a recommendation to buy or sell cryptocurrency and should not be viewed as an endorsement by CoinIdol. Readers should do their own research before investing
Price
Price
Price
Price
Price

(0 comments)