Ripple Makes a Steady Decline after a Sharp Spike towards $0.65
Updated: Dec 22, 2020 at 12:26
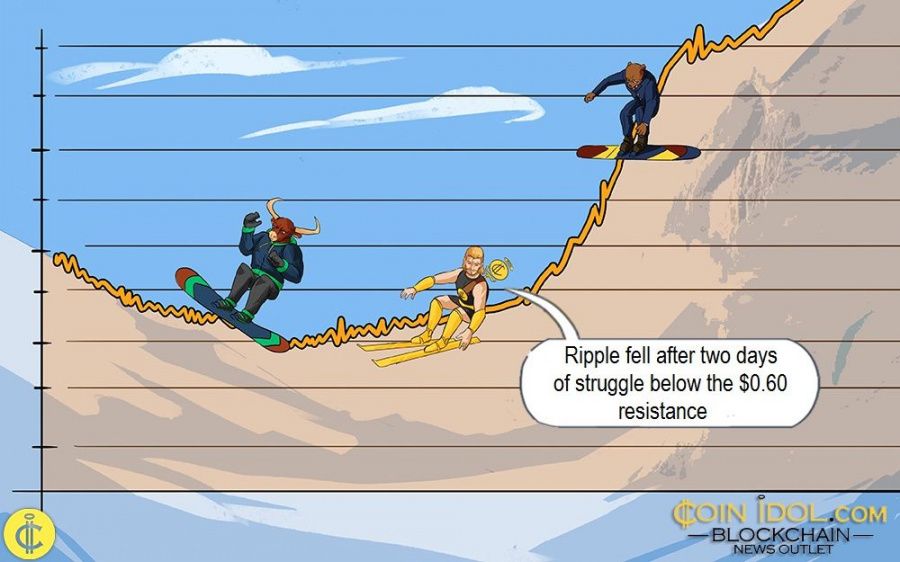
Ripple slumps down after failing to break the $0.60 resistance. The altcoin had earlier rebounded on December 16 to retest the previous highs but could not.
A daily candlestick on December 17 with a long wick has indicated strong selling pressure above the recent high. Ripple fell after two days of struggle below the $0.60 resistance. The coin has fallen to the support of the 50-day SMA. The crypto risks a further downward move if it breaks below the second moving average (50-day SMA). The coin will fall into the bearish trend zone. Alternatively, if the 50-day SMA support holds, there is a likelihood of uptrend resumption.
Ripple indicator analysis
The coin is trading at level 47 of the Relative Strength Index period 14. It indicates that XRP is in the downtrend zone and that the bullish momentum is likely to continue. The 21-day SMA and 26-day SMA are sloping upward indicating the previous uptrend.

Key Resistance Zones: $0.80, $0.85, $0.90
Key Support Zones: $0.40, $0.35, $0.30
What is the next move for Ripple?
Ripple downward move has reached bearish exhaustion. The current downturn was a result of rejection at the $0.60 resistance. XRP corrected upward at the 61.8 % retracement level and plunged exactly at the 1.618 Fibonacci extension. The downtrend is likely to be over. The daily stochastic indicator has confirmed that XRP has fallen below the 20% range. In other words, it is in the oversold region, and buyers are expected to emerge.

Disclaimer. This analysis and forecast are the personal opinions of the author that are not a recommendation to buy or sell cryptocurrency and should not be viewed as an endorsement by CoinIdol. Readers should do their own research before investing funds.
Price
News
Politics
Coin expert
News

(0 comments)