Ripple Loses Important Levels as Bears Gain More Grounds

In the last 48 hours, Ripple fell to a $0.17 low but price corrected upward to retest the $0.18 high. The market is still on a downward move after a second retest at the $0.18 high.
Despite the recent correction, the price action is indicating a bearish signal. A Fibonacci tool is used to determine the extent of the downward move.
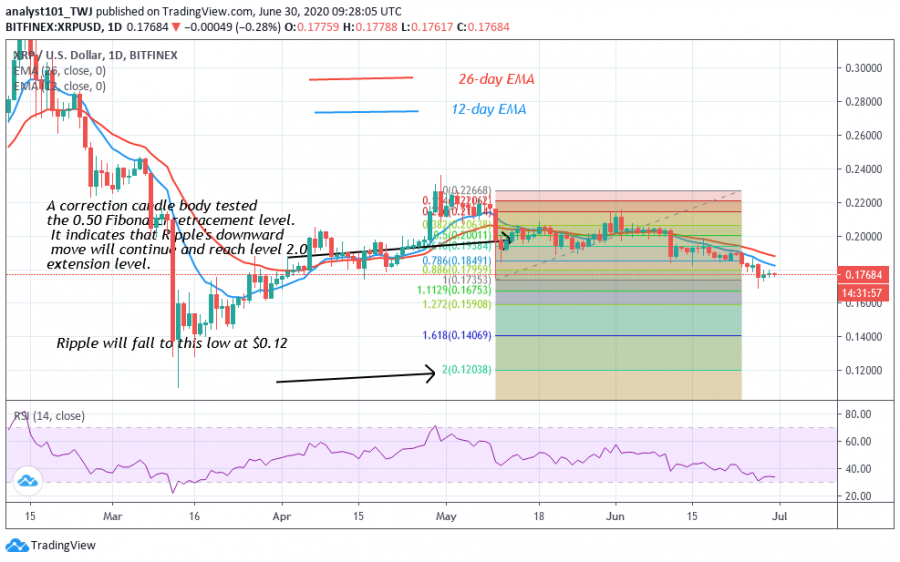
The bearish impulse of May was used to determine the extent of the downward move. A correction candle body tested the 0.50 Fibonacci retracement level. It indicates that Ripple's downward move will continue and reach level 2.0 extension level. In other words, the market will fall and reach a low of $0.12 as the price continues its fall. Meanwhile, XRP is trading at $0.176 at the time of writing.
Ripple indicator analysis
Ripple has fallen to level 34 of the Relative Strength Index period 14. This indicates that XRP is approaching the oversold region of the market. In other words, the selling pressure is waning down. The price bars are below the EMAs which indicates a further downward movement of the coin.

Key Resistance Zones: $0.35, $0.40, $0.45
Key Support Zones: $0.25, $0.20, $0.15
What is the next move for Ripple?
Ripple is likely to continue the downtrend as the price action indicates bearish signals. The Fibonacci tool has indicated a further downward move to a low of $0.12. Presently, the price has started dropping from $0.18 high. XRP has fallen to $0.176 and it is approaching the $0.17 low. The next support will be at $0.1680 low.
Disclaimer. This analysis and forecast are the personal opinions of the author that are not a recommendation to buy or sell cryptocurrency and should not be viewed as an endorsement by CoinIdol. Readers should do their own research before investing funds.
News
Price
Price
Price
Price

(0 comments)