Ripple Holds Up As Investors Rally Above $0.46
Updated: Jun 25, 2024 at 11:44

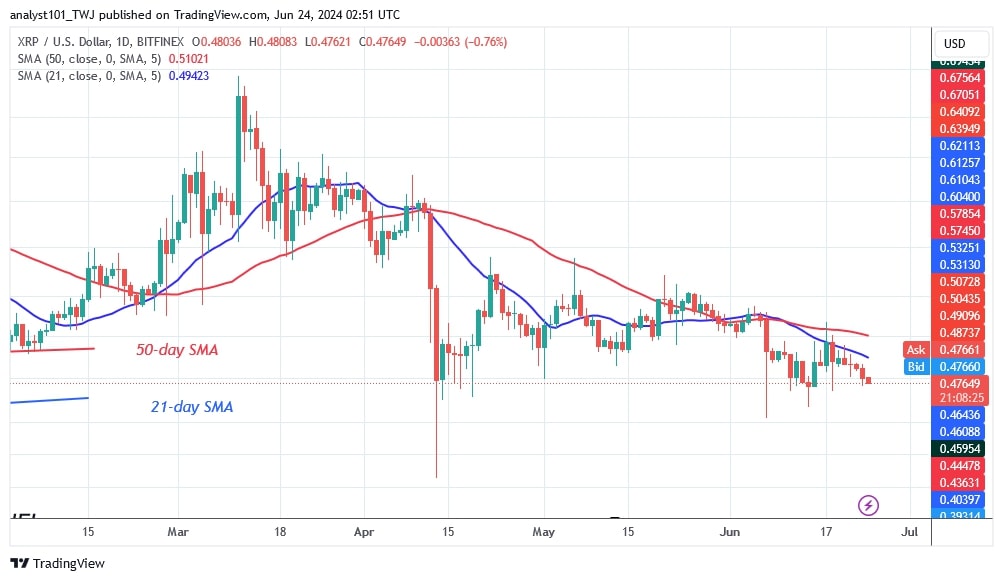
The price of the Ripple coin (XRP) is falling and approaching the critical support level of $0.46. Price analysis by Coinidol.com.
Long-term analysis of Ripple: fluctuation
Since April 13, the altcoin has regularly traded above the $0.46 support but below the moving average lines or the $0.51 resistance level. On June 17, buyers tried to hold the price above the moving average lines but failed to do so. However, the bears are threatening the current support at $0.46 as the cryptocurrency falls.
If the altcoin falls and stays above the current support level of $0.46, the range-bound movement will continue for a few more days. However, at the time of writing, the cryptocurrency has fallen to a low of $0.47. If the bears succeed, the altcoin will crash and return to its previous low of $0.41.
XRP indicator analysis
The price bars have been below the moving average lines since June 7. The bears have pushed the price further into the negative trend zone. XRP will rally if the price breaks down and then rises above the existing support. The doji candlesticks have consistently influenced price movements.
Technical indicators:
Key resistance levels – $0.80 and $1.00
Key support levels – $0.40 and $0.20

What is the next direction for XRP?
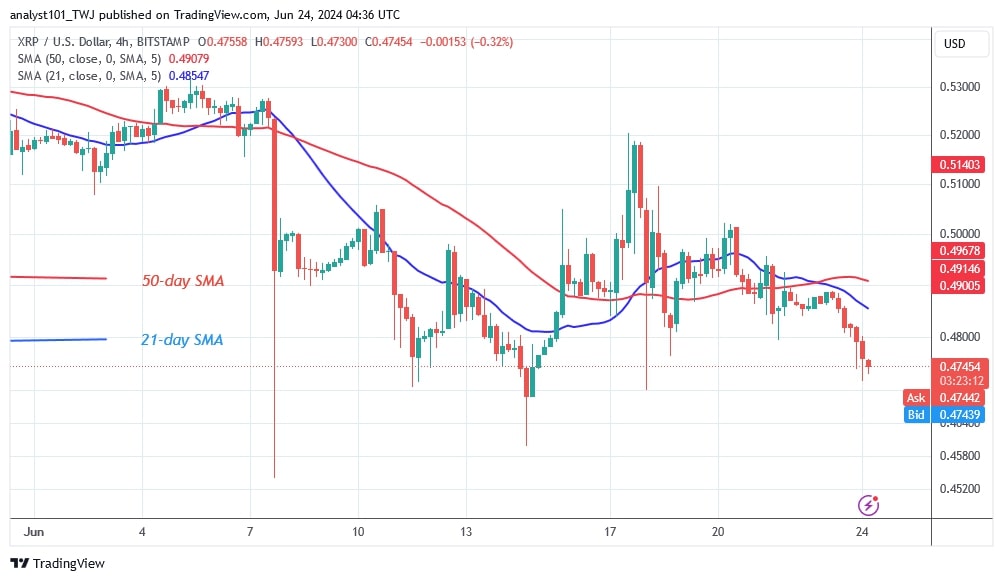
The cryptocurrency is in a sideways trend on the 4-hour chart. The altcoin is currently trading between $0.46 and $0.50. The price bars remain below the moving average lines while the price of the cryptocurrency is retesting the current support level of $0.46. XRP will rally each time it retests the current support level of $0.46.

Disclaimer. This analysis and forecast are the personal opinions of the author and are not a recommendation to buy or sell cryptocurrency and should not be viewed as an endorsement by CoinIdol.com. Readers should do their research before investing in funds.
Price
News
Price
Price
Price

(0 comments)