Ripple Resumes Fresh Downtrend, May Retest $0.21 Low

The upward move on December 24 was short-lived as Ripple faced another rejection. If buyers have pushed XRP above $0.50, the upside momentum would have resumed.
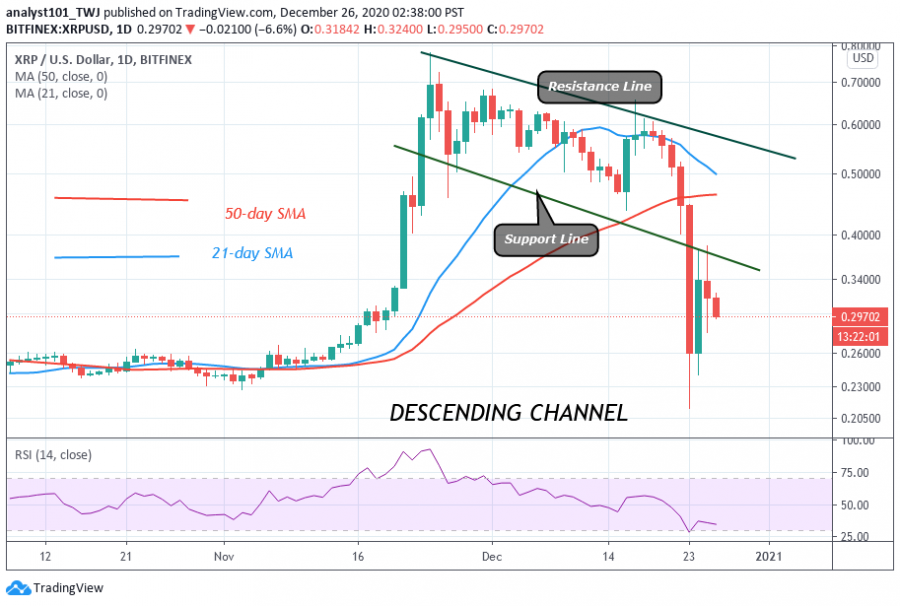
Rather, the price correction was interrupted at the $0.35 high. Today, Ripple is trading at $0.296 at the time of writing. If the planned downtrend resumes, the crypto will further decline to $0.15 low. Meanwhile, if Ripple falls and finds support above $0.20 or $0.25, the upward move will resume. Technically, if price retraces and holds above the previous support at $0.21, it is more convincing to move upward. On the other hand, if price breaks the previous support, the downward move will be accelerated.

Key Resistance Zones: $0.80, $0.85, $0.90
Key Support Zones: $0.40, $0.35, $0.30
Ripple indicator analysis
The crypto’s price has broken the 21-day SMA and the 50-day SMA. This indicates that there is a tendency for the coin to fall. The Relative Strength Index is indicating that the coin has fallen to level 34. It falls below level 30, it will be in the oversold region as buyers may emerge to push the coin upward.
What is the next move for Ripple?
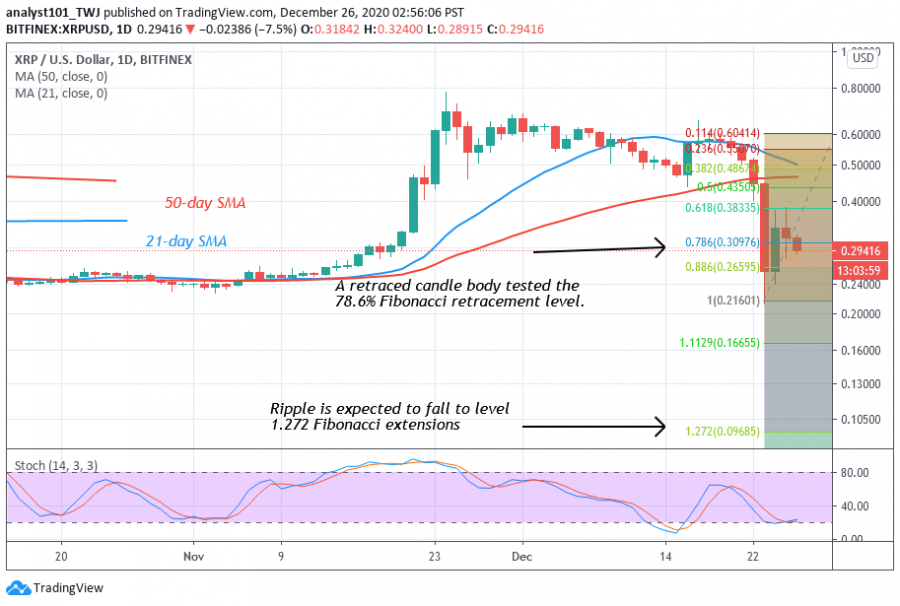
A Fibonacci tool has been drawn to determine the extent of the downward movement. On December 23 downtrend; a retraced candle body tested the 78.6% retracement level. The retracement suggests that Ripple will fall to level 1.272 Fibonacci extension or $0.0968 high. Approximately, the coin will reach the low at $0.10.

Disclaimer. This analysis and forecast are the personal opinions of the author that are not a recommendation to buy or sell cryptocurrency and should not be viewed as an endorsement by CoinIdol. Readers should do their own research before investing
News
Price
Price
Price
Price

(0 comments)