Ripple Continues Its Downward Slide And Targets The Low At $0.43

The price of Ripple (XRP) is falling as buyers are unable to get above the $0.55 resistance level.
Long-term forecast for the Ripple price: bearish
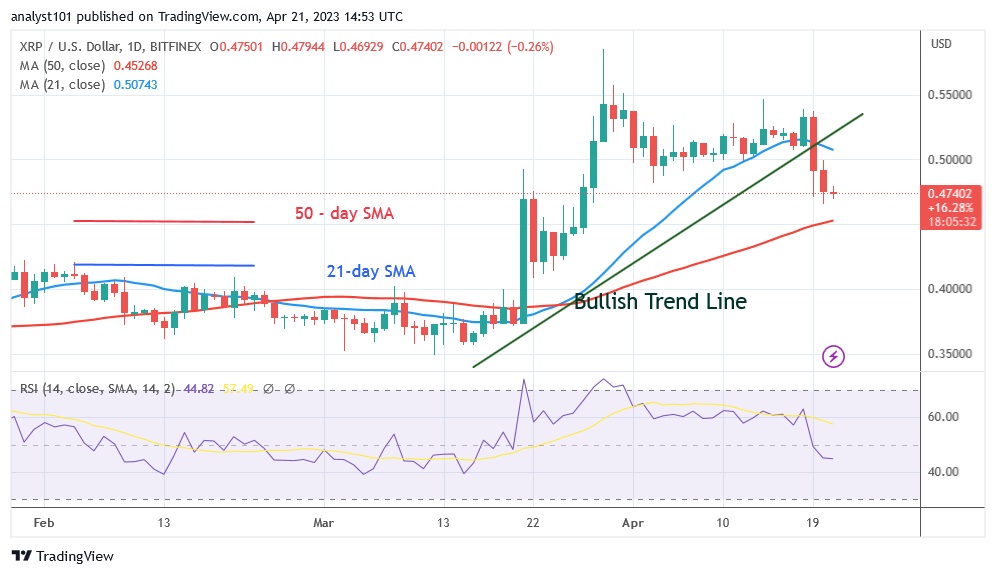
The price of the cryptocurrency has fallen below the 21-day line SMA, ending the previous uptrend. The current decline extends to the low of the 50-day line SMA. This means that the price of the cryptocurrency will continue to fall. After an early dip, XRP is currently trading at $0.47.
It is expected that the cryptocurrency value will reach a low of 0.43 during its current decline. If the price of XRP drops during the downturn and holds above the 50-day line SMA, we can expect a move between the moving average lines. On the other hand, a break below the moving average lines will increase selling pressure.
Ripple indicator analysis
According to the Relative Strength Index of period 14, Ripple is currently trading at level 44. The cryptocurrency asset has fallen further to its previous low and is currently in the bearish trend zone. The XRP price is currently between the moving average lines, suggesting that prices will continue to fluctuate in a range. Above the daily stochastic value of 50, XRP has positive momentum. The fact that the price is trapped below $0.48 has caused the upward momentum to fade.

Technical indicators:
Key resistance levels - $0.80 and $1.00
Key support levels - $0.40 and $0.20
What is the next move for Ripple?
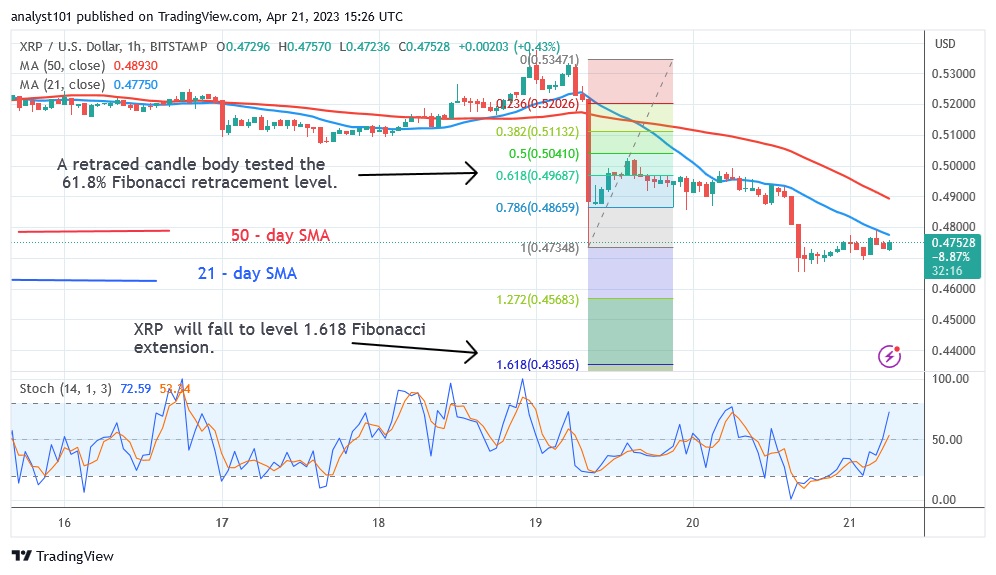
On the 1-hour chart, XRP is declining and may continue to do so. XRP had an upward correction during the April 19 decline, and a candlestick tested the 61.8% Fibonacci retracement level. After the correction, XRP falls below the $0.43 level of the 1.618 Fibonacci extension. The altcoin has fallen to a low of $0.47 after the price movement when this article was written.

Disclaimer. This analysis and forecast are the personal opinions of the author and are not a recommendation to buy or sell cryptocurrency and should not be viewed as an endorsement by CoinIdol. Readers should do their own research before investing
News
News
Price
Price
Price

(0 comments)