Ripple Consolidates Below $0.80 and Could See a Rally or Breakout

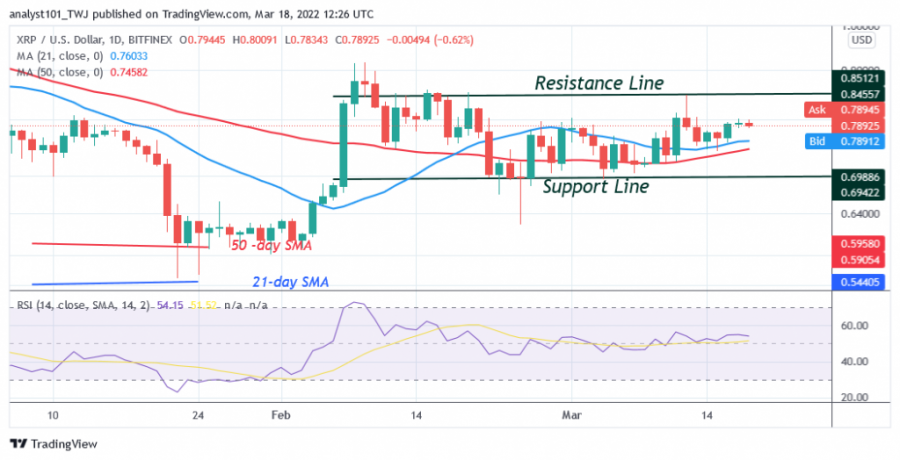
The price of Ripple (XRP) remains in the bullish trend zone, although it failed to overcome the resistance at $0.80. Since March 9, buyers have defended the moving averages as XRP finds support above them.
Ripple (XRP) price long-term forecast: bullish
Today, XRP is trading at $0.79 as of press time. The cryptocurrency is fluctuating below the resistance level.
XRP will rise as long as the price bars above the moving averages. When XRP consolidates below a resistance level, it increases the chances of a breakout. A breakout above resistance at $0.80 will catapult XRP above the high at $0.90. The bullish momentum will extend to the overriding resistance of $1.00.
However, if the bears break below the moving averages, the bullish scenario would be nullified. Sellers will try to push XRP to the previous low.
Ripple (XRP) indicator analysis
The price bars of the cryptocurrency are above the moving averages, which indicates a possible rise in the cryptocurrency. XRP is at level 54 of the Relative Strength Index of period 14. The cryptocurrency is in the bullish trend zone. Ripple is below the 53% range of the daily stochastic. The 21-day line and the 50-day moving averages line are horizontally sloping, indicating a sideways trend. XRP/USD is below the 80% area of the stochastic on the daily chart. The market is in a bearish momentum.

Technical indicators:
Major Resistance Levels – $1.95 and $2.0
Major Support Levels – $0.80 and $0.60
What is the next move for Ripple (XRP)?
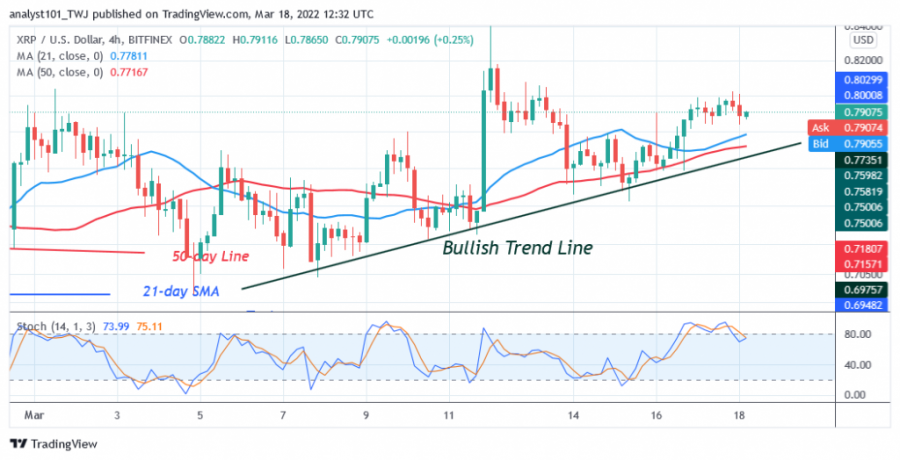
On the 4-hour chart, XRP/USD is in an upward movement. The XRP price is posting a series of higher highs and higher lows. A bullish trend line is drawn, indicating the support lines of the cryptocurrency. The altcoin will resume its downtrend when the price falls below the trend line.

Disclaimer. This analysis and forecast are the personal opinions of the author are not a recommendation to buy or sell cryptocurrency and should not be viewed as an endorsement by CoinIdol. Readers should do their own research before investing
Price
Price
Price
Price
Price

(0 comments)