Ripple Continues Its Sideways Trend and is Under Selling Pressure at $0.36

The price of Ripple (XRP) is in an upward correction as the price breaks above the moving average lines.
Ripple price long-term forecast: bearish
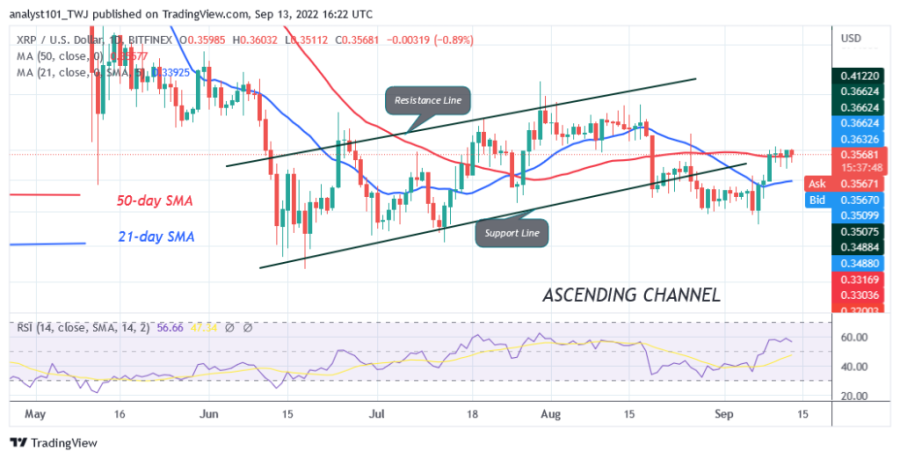
The bullish momentum could not be sustained above the moving average lines, hence the decline. Today, XRP is trading between the moving average lines. This means that the cryptocurrency asset will be forced to move sideways between the moving average lines. In other words, XRP/USD is trading between $0.32 and $0.34. However, if XRP rallies, the altcoin will regain resistance at $0.39 and $0.41. On the other hand, if the cryptocurrency value falls and breaks below the $0.32 support, the market will continue to fall to the lows of $0.32 and $0.30.
Ripple indicator analysis
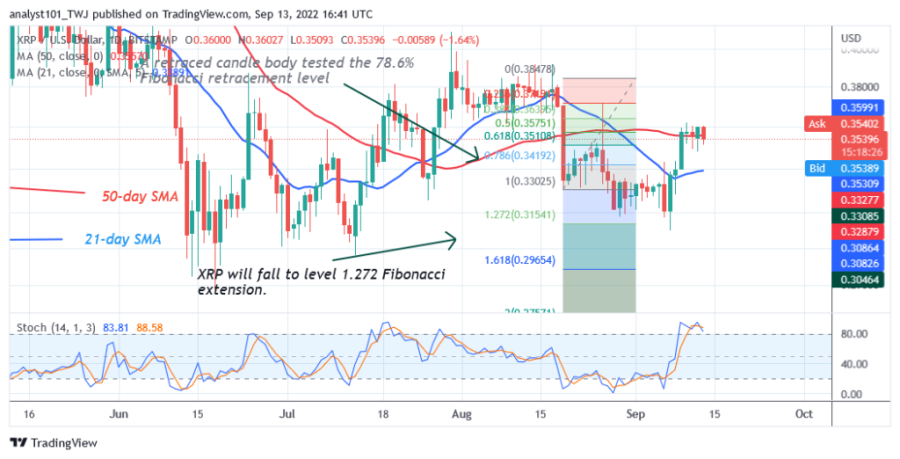
Ripple is at level 58 of the Relative Strength Index for the period 14. XRP is trading in the bullish trend zone due to the upward correction. The price of XRP is between the moving average lines, which indicates that the altcoin will fluctuate between the moving average lines. The altcoin is above the 80% area of the daily stochastic. This indicates that XRP is in the overbought region of the market. The cryptocurrency is likely to go down. The moving average lines are sloping to the north, indicating an uptrend.

Technical Indicators
Key resistance zones: $0.40, $0.45, $0.50
Key support zones: $0.30, $0.25, $0.20
What is the next move for Ripple ?
Ripple is in an upward correction as the price has reached the high of $0.36. XRP is about to reject the recent high. The altcoin is bearish as it faces rejection in the overbought zone. The sideways movement will resume if the altcoin falls back above the 21-day line SMA.

Disclaimer. This analysis and forecast are the personal opinions of the author and are not a recommendation to buy or sell cryptocurrency and should not be viewed as an endorsement by CoinIdol. Readers should do their own research before investing
Price
Price
Price
Price
Price

(0 comments)