Ripple Continues Horizontal Trend But Gets Stuck

The price of Ripple (XRP) coin is trading above the moving average lines, but its movement has been stuck in a range since March 5. Price analysis by Coinidol.com.
Long-term forecast for the Ripple price: bullish
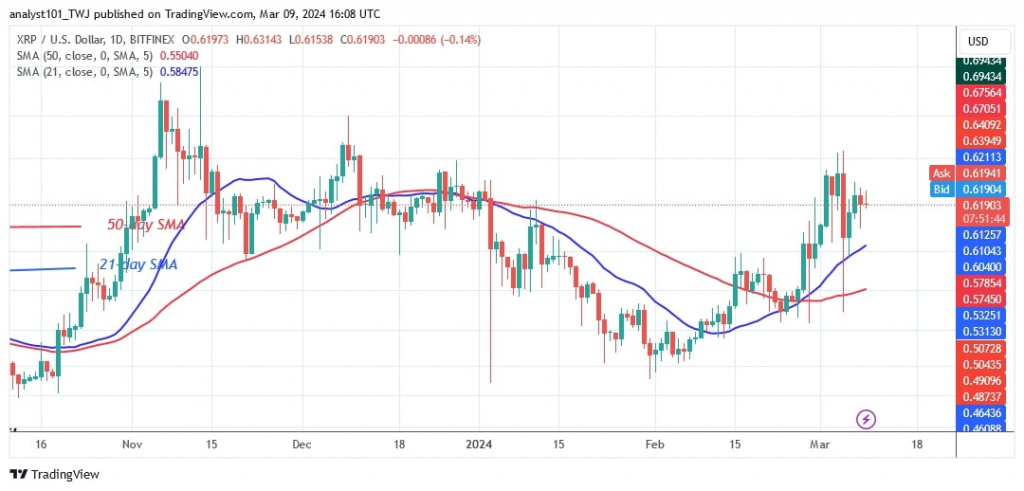
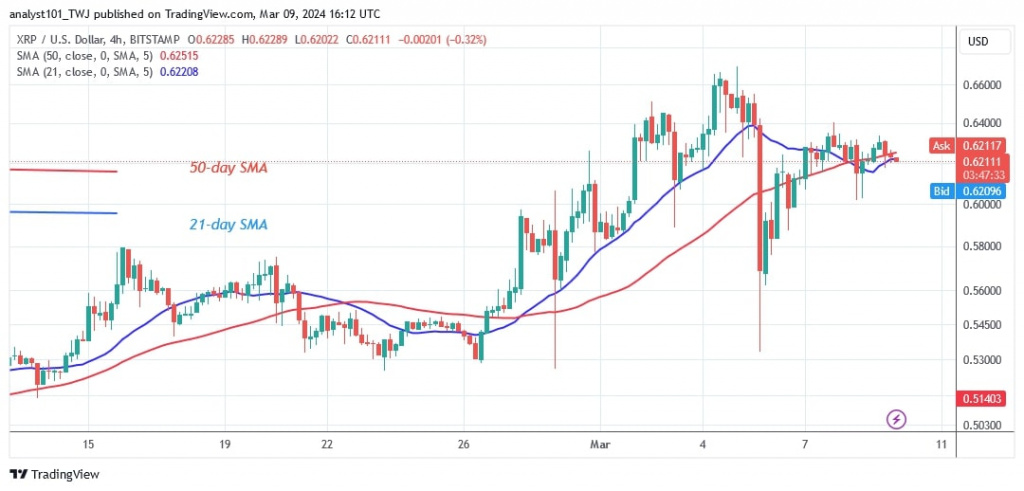
On March 5, buyers pushed XRP to a high of $0.66 before being rejected. The altcoin fell sharply to a low of $0.53, but the bulls bought the dips.
On the downside, the bulls halted the slide above the 50-day SMA while the upside momentum was caught at the $0.66 resistance level. Since March 5, XRP has been trading in a price range of $0.55 to $0.66. The extended candlestick tail indicates significant buying pressure at the $0.55 support level. If the bears breach the $0.55 support, the altcoin will retest its previous low of $0.50. XRP is now worth $0.62.
XRP indicator analysis
Since February 15, 2024, the price bars have been above the moving average lines. The uptrend has stalled below the $0.67 resistance. The cryptocurrency's fortunes are limited to a range. The altcoin is forming a doji candlestick above its current support. The presence of doji candlesticks restricts the cryptocurrency's uptrend.
Technical indicators:
Key resistance levels – $0.80 and $1.00
Key support levels – $0.40 and $0.20

What's next for Ripple?
XRP is in a downtrend but has resumed a sideways trend. The upward movement is still limited at the high of $0.64. The price of the cryptocurrency is now oscillating above the $0.62 support. The altcoin has a probability of growing because the price bars are higher than the moving average lines.

Disclaimer. This analysis and forecast are the personal opinions of the author and are not a recommendation to buy or sell cryptocurrency and should not be viewed as an endorsement by CoinIdol.com. Readers should do their research before investing in funds.
Price
Price
Price
News
Price

(0 comments)