Ripple Is in a Downward Correction above $1.25 Support, Unable to Push Above $1.40 High

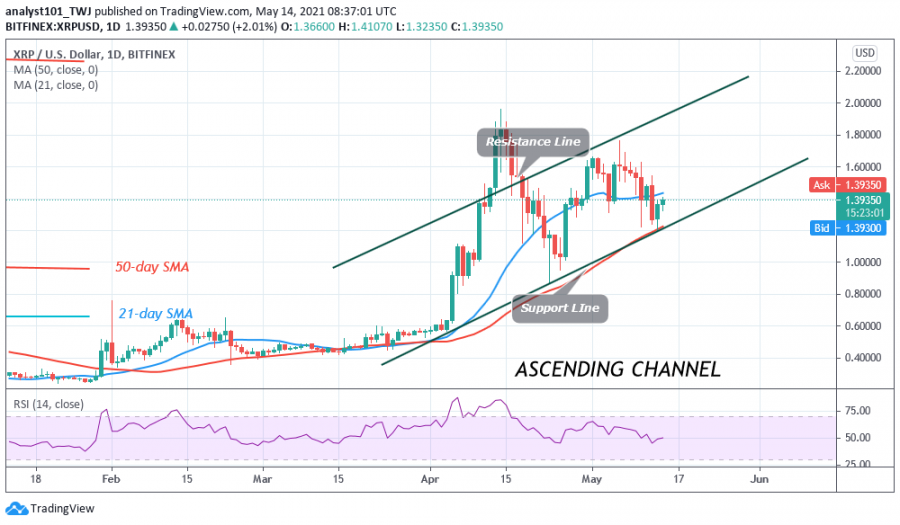
Since the last bearish impulse on May 12, the downward move has been stalled above the $1.25 support level. The current support has been tested by the bears on more than three occasions but was repelled.
If buyers can push XRP above the $1.50 high, Ripple will resume an upward move. The altcoin will be out of downward correction. However, the current uptrend is facing resistance at the $1.40 high.
If the bulls face rejection at the recent high, XRP will fall and resume a range-bound move. In the previous price action on May 13, the bulls were resisted at the $1.38 high. The market declined to the current support at the $1.38 price level. Presently, if buyers face rejection at the $1.40 resistance, the range-bound movement between $1.25 and $1.40 will continue for a few more days. XRP/USD is trading at $1.39 at the time of writing.
Ripple indicator analysis
XRP finds support above its 50-day SMA as the altcoin resumes upward. A break above the 21-day SMA will mean the resumption of a possible uptrend. Ripple is at level 50 of the Relative Strength index period 14. It indicates that there is a balance between supply and demand. Ripple is above the 40% range of the daily stochastic. This indicates that the market has bullish momentum.

Technical indicators:
Major Resistance Levels – $1.95 and $2.0
Major Support Levels – $0.60 and $0.55
What is the next move for Ripple?
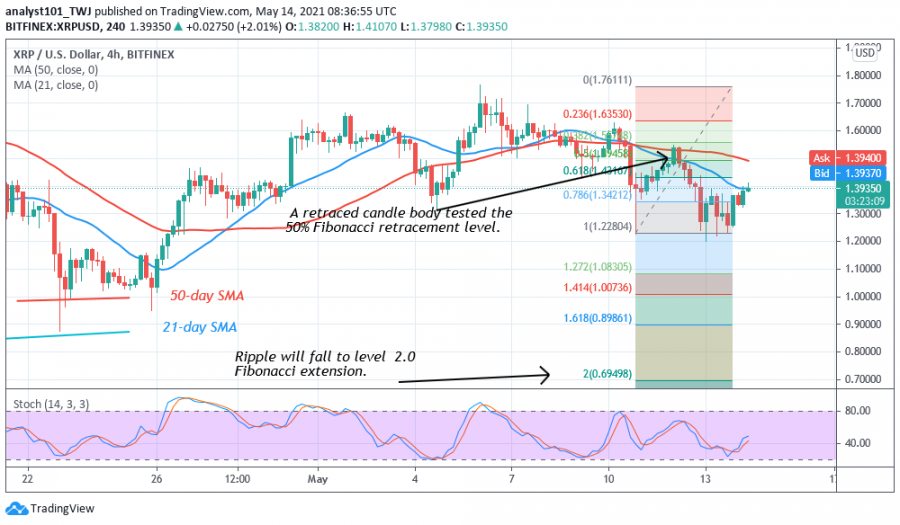
Ripple bulls are testing the minor resistance at $1.40 to break it. A breakout will enable the altcoin to reach the bullish trend zone. Similarly, if XRP falls and the bears break the $1.25 support, XRP will decline to $1.00 low. Perhaps, the Fibonacci tool analysis may hold. Meanwhile, on May 10 downtrend; a retraced candle body tested the 50% Fibonacci retracement level. The retracement indicates that Ripple is likely to fall to level 2.0 Fibonacci extension or the low of $0.69.

Disclaimer. This analysis and forecast are the author’s personal opinions and not a recommendation to buy or sell cryptocurrency and should not be viewed as an endorsement by CoinIdol. Readers should do their own research before investing
News
Price
Price
Price
Price

(0 comments)