Ripple Slumps as It Faces Rejection at the $0.34 Resistance Zone
Updated: Sep 06, 2022 at 11:19

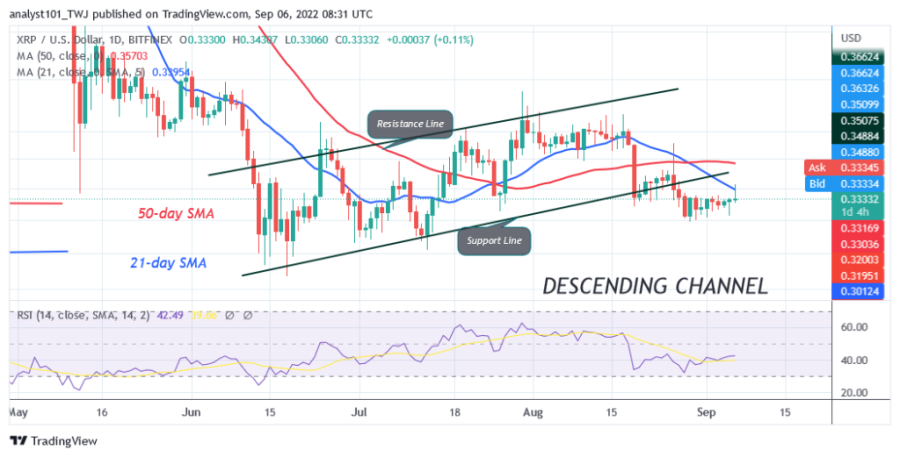
The price of Ripple (XRP) is still in a downtrend, but is making an upward correction to previous highs. Since August 28, XRP has been holding above the $0.32 support.
The current upward movement is bumping up against the high of $0.34 or the 21-day moving average line. This means that the cryptocurrency is trapped between $0.32 and $0.34 price levels.
Sellers might have the upper hand as the altcoin is trading in the bearish trend zone. Ripple is bearish as it faces rejection at the high of $0.34. The cryptocurrency asset will fall back to the previous low at $0.30 if selling pressure resumes and drops below the current support. However, if buyers break through the $0.34 resistance, the altcoin will rally above the moving average lines. The bullish momentum will extend to the resistance at $0.39. In the meantime, XRP has fallen back above $0.33 support.
Ripple indicator analysis
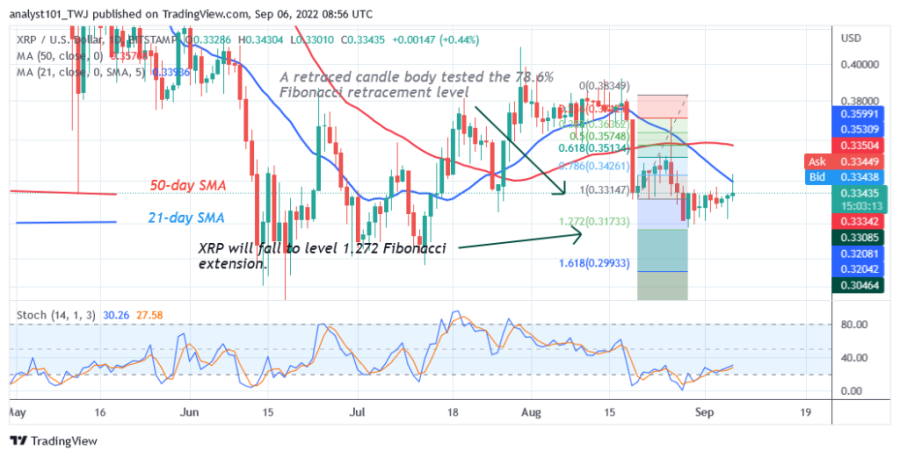
Ripple is at level 42 of the Relative Strength Index for the period 14. The altcoin is moving back to the downside zone as it faces a rejection of the recent high. The price of the cryptocurrency is below the moving average lines, which suggests a further decline. The altcoin is above the 25% area of the daily stochastic. XRP was in an upward momentum, but the upward movement was terminated. The 21-day line SMA and the 50-day line SMA are sloping south, indicating a downtrend.

Technical indicators
Key Resistance Zones: $0.40, $0.45, $0.50
Key Support Zones: $0.30, $0.25, $0.20
What is the next move for Ripple?
Ripple has made an upward move but faces rejection at the recent high. XRP is falling back to the lower price area. Meanwhile, on August 19, the downtrend has shown a retraced candle testing the 78.6% Fibonacci retracement level. The retracement suggests that XRP will fall to the 1.272 Fibonacci Extension or $0.31 level.

Disclaimer. This analysis and forecast are the personal opinions of the author and are not a recommendation to buy or sell cryptocurrency and should not be viewed as an endorsement by CoinIdol. Readers should do their own research before investing
News
Price
Price
News
Price

(0 comments)