Quant Price Moves Sideways But Threatens A Drop To $91

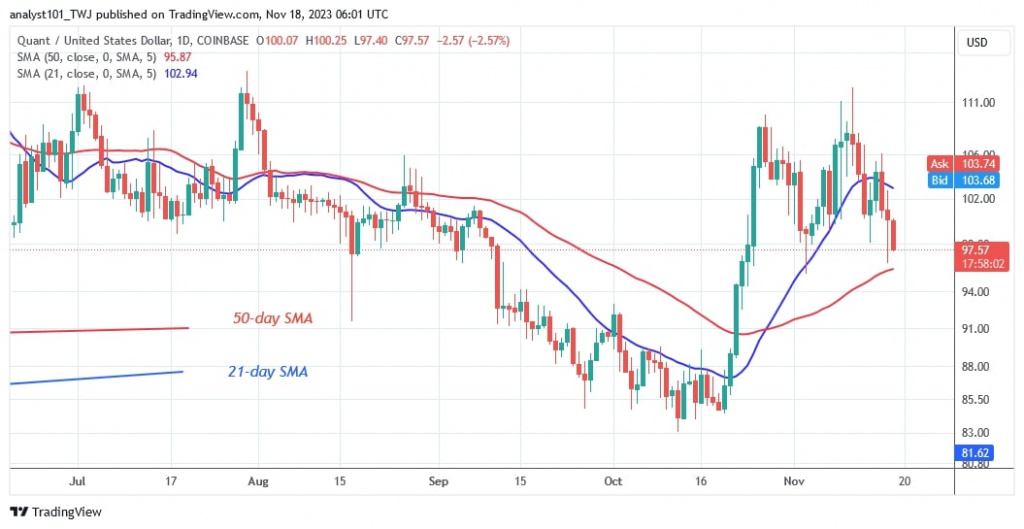
The price of Quant (QNT) is falling after breaking through resistance at $110 three times. Weekend price analysis by Coinidol.com.
Long-term quant price forecast: bearish
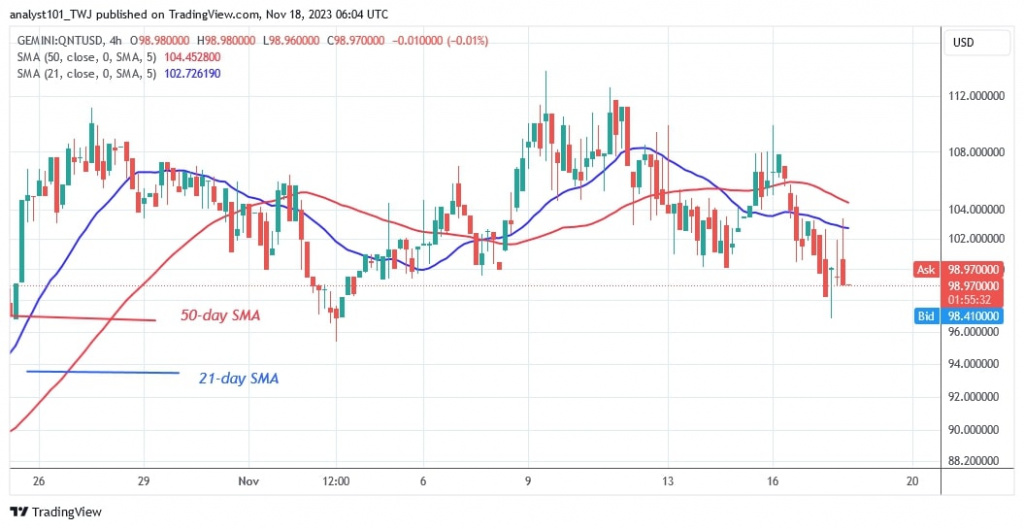
Initially, the price of the Quant fell below the 21-day SMA and retested the moving average line and resistance at $106 before falling further. Bearish momentum reaches the 50-day moving average line. If the bears break the 50-day SMA line, the selling pressure will continue to the previous lows.
Beyond that, QNT will drop to a new low of $91. The altcoin will be forced to move in a range between the moving average lines if the 50-day SMA support holds. The price of QNT/USD currently stands at $96.88.
Quant price indicator analysis
QNT/USD has fallen within the moving average lines as a result of the recent decline. The altcoin will therefore fluctuate between the moving average lines. QNT will develop a trend when it breaks above the moving average lines. The moving average lines are sloping upwards, indicating that the previous trend is still in place.
Technical Indicators
Key supply zones: $140, $150, $160
Key demand zones: $90, $80, $70

What is the next move for Quant?
Quant has shifted to a sideways movement after being rejected at the $110 resistance level. The cryptocurrency will continue to fluctuate for a few more days as it is trapped between moving average lines. If the price of QNT falls below it, the decline will resume.
The price of Quant has been fluctuating between $96 and $110 since October 26, as Coinidol.com reported in our previous analysis.

Disclaimer. This analysis and forecast are the personal opinions of the author and are not a recommendation to buy or sell cryptocurrency and should not be viewed as an endorsement by CoinIdol.com. Readers should do their research before investing in funds.
News
Coin expert
News
Price
Price

(0 comments)