Polkadot Pushes on the Upside, Struggles below Initial Resistance at $29
Updated: Dec 25, 2021 at 10:58

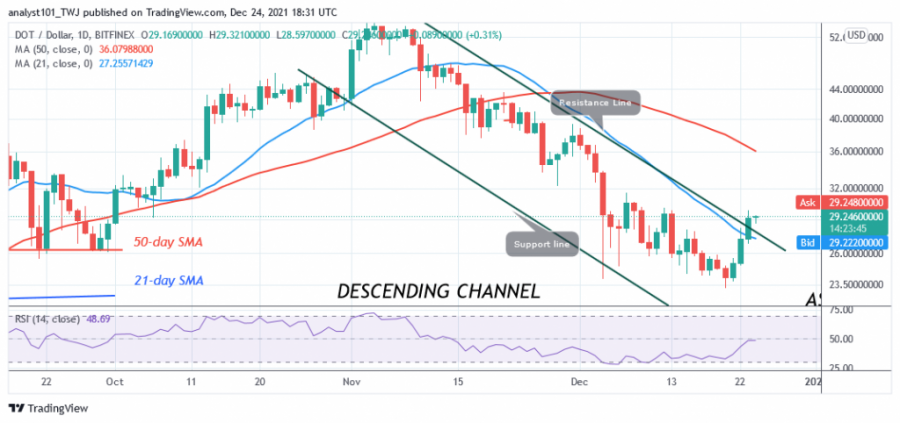
On December 20, the price of Polkadot (DOT) bounced above the previous low at $23.50. This is the second time DOT's price has bounced off the previous low.
On December 4, the price had fallen to the same low. The recovery has pushed the altcoin to rise above the 21-day moving average line. The upward movement has continued to the upside. Polkadot will resume its upward momentum as buyers push the altcoin above the 50-day moving average line. In other words, buyers need to keep the price above the $40 high. The bullish momentum will extend to the previous high of $55. Meanwhile, DOT/USD is approaching the $31 high but is trading at $29.33 at press time.
Polkadot indicator analysis
The recent upward movement has taken Polkadot to level 48 on the Relative Strength Index for the 14 period. This indicates that the altcoin is still in a downtrend but approaching the uptrend. The price of DOT is above the 21-day moving average line, but below the 50-day moving average line. The cryptocurrency is above the 80% area of the daily stochastic. The altcoin is trading in the overbought region of the market. The market could decline in the overbought region.

Technical indicators:
Major Resistance Levels - $52 and $56
Major Support Levels - $28 and $24
What is the next direction for Polkadot?
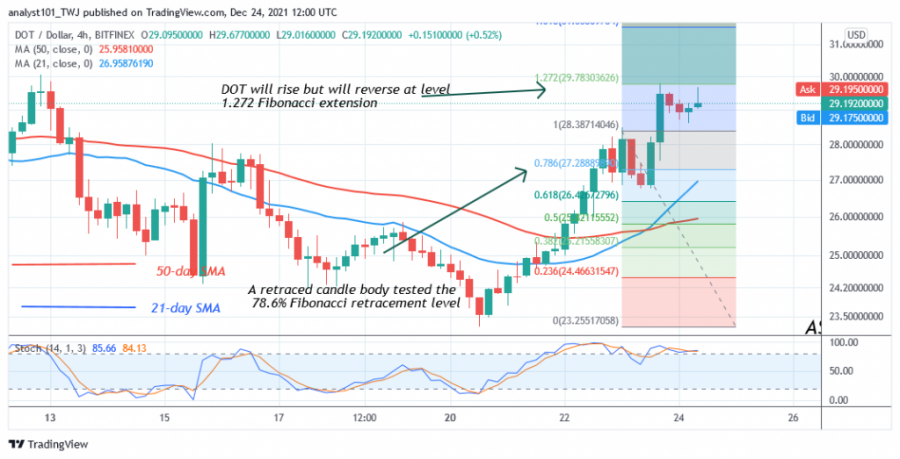
On the 4-hour chart, Polkadot has resumed its uptrend. Currently, it is trading in the overbought zone of the market. Meanwhile, the uptrend from December 23 has seen a retracement candlestick testing the 78.6% Fibonacci retracement level. The retracement suggests that DOT will rise but reverse at the 1.272 Fibonacci extension level or $29.29.

Disclaimer. This analysis and forecast are the personal opinions of the author and are not a recommendation to buy or sell cryptocurrency and should not be viewed as an endorsement by CoinIdol. Readers should do their research before investing funds.
Price
News
Price
Price
Price

(0 comments)