Polkadot Is in a Sideways Move Below the $38 Resistance Level

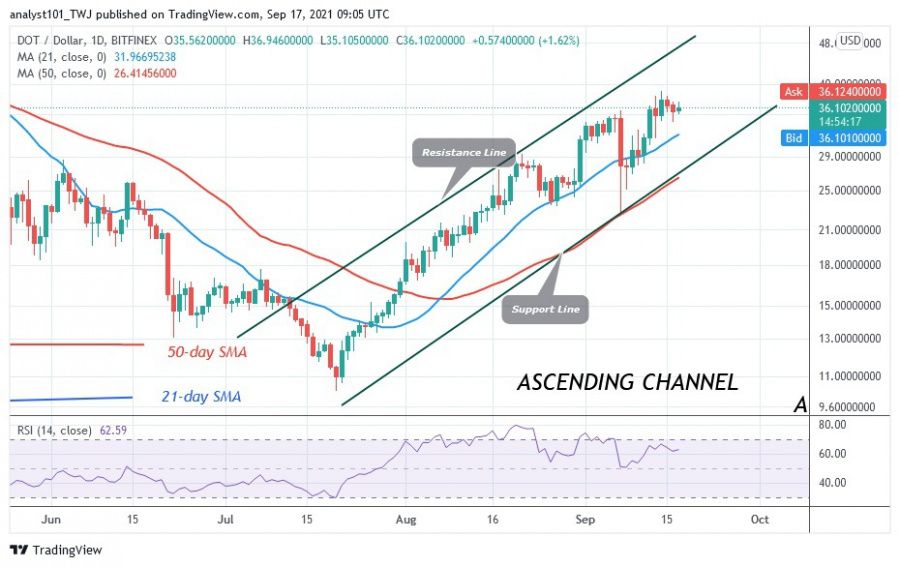
The price of Polkadot (DOT) has continued its uptrend as the price remains above the moving averages. However, buyers have failed to break above the $40 resistance level.
Polkadot (DOT) Long-Term Analysis: Fluctuation Range
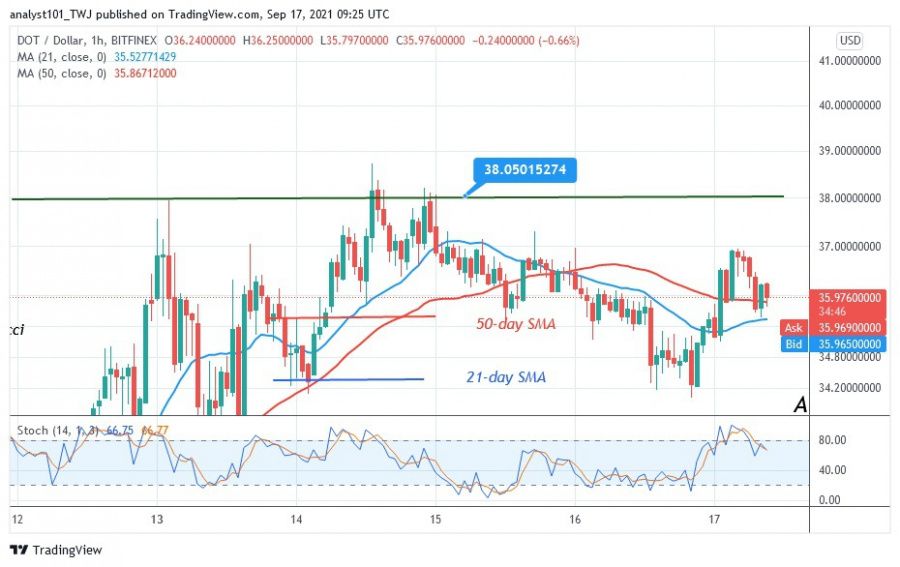
The DOT price hit a high of $37 today, but was pushed back. The altcoin is falling and could hit the previous low at $34. The market will go back up if the support at $34 holds. This is how the price has been moving since September 13. Currently, the bulls are struggling to overcome the upper resistance of $40. Polkadot is trading at $35.16 at the time of writing.
Polkadot (DOT) Indicator Analysis
The price of DOT is at the level 60 of the Relative Strength Index of the period 14. The cryptocurrency asset is in the uptrend zone and is able to continue its uptrend further. DOT/USD will continue to rise as long as the price bars are above the 21-day and 50-day SMAs. The altcoin is below the 80% range of the daily stochastic. This indicates that the market is in a bearish momentum.

Technical Indicators:
Major Resistance Levels - $48, $52, $56
Major Support Levels - $32, $28, $24
What is the next direction for Polkadot (DOT)?
Polkadot is in a sideways move below the $38 resistance level. Over the past five days, buyers have been desperately trying to hold above the recent high. The altcoin is on the retreat due to strong resistance at the recent high. DOT/USD is likely to trade in a range for a few more days.

Disclaimer. This analysis and forecast are the personal opinions of the author are not a recommendation to buy or sell cryptocurrency and should not be viewed as an endorsement by CoinIdol. Readers should do their research before investing funds.
Price
Coin expert
Price
Price
Price

(0 comments)