Polkadot Revisits Previous Low at $20, Faces Rejection at $26

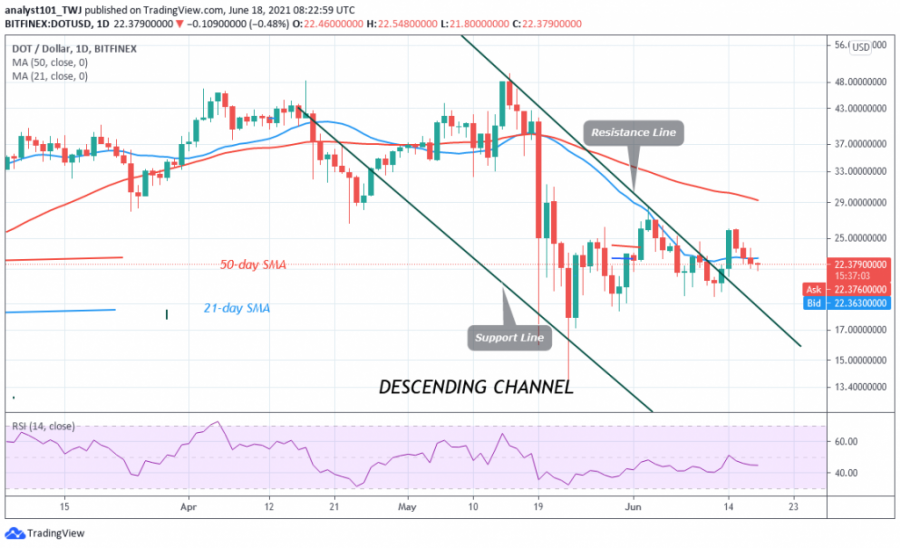
Polkadot (DOT) has fallen to $22 low from the previous high of $29. Since the crypto began falling, DOT price was making a series of lower highs and lower lows.
When the price fell and made a lower low at $20, the crypto rebounded above the current support and rallied to the previous lower highs. The rally was stalled at the lower high of $26.
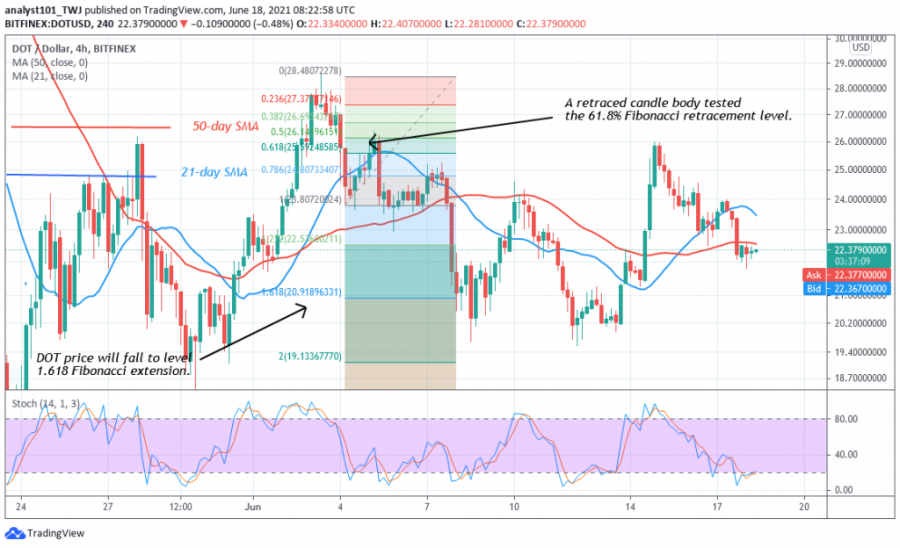
The selling pressure resumes as bulls fail to break the $26 high. The current downtrend is likely to extend to the low at $20. Since June 8, the DOT price has been retesting the support at $20. Nevertheless, the crypto’s price has broken below the moving averages signaling the resumption of a downtrend.
Polkadot indicator analysis
The market is at level 44 of the Relative Strength Index period 14. The crypto is in the bearish trend zone and below the centerline 50. DOT price has fallen below the 20% range of the daily stochastic. It indicates that the price has fallen to the oversold region. It means that selling pressure has reached bearish exhaustion. The 21-day and the 50-day SMA are sloping southward indicating the downtrend.

Technical indicators:
Major Resistance Levels – $48 and $52
Major Support Levels – $22 and $18
What is the next direction for Polkadot?
Polkadot is in a downward move. DOT has fallen to the oversold region of the market. On June 4 downtrend; a retraced candle body tested the 61.8% Fibonacci retracement level. The retracement indicates that DOT will fall to level 1.618 Fibonacci extensions or level $20.91. From the price action, DOT price tested the Fibonacci level has been retested as price resumes upward

Disclaimer. This analysis and forecast are the author’s personal opinions, are not a recommendation to buy or sell cryptocurrency and should not be viewed as an endorsement by CoinIdol. Readers should do their research before investing funds.
Price
Price
Price
Price
Price

(0 comments)