Polkadot Rallies but Holds Steady at the $6.60 Peak

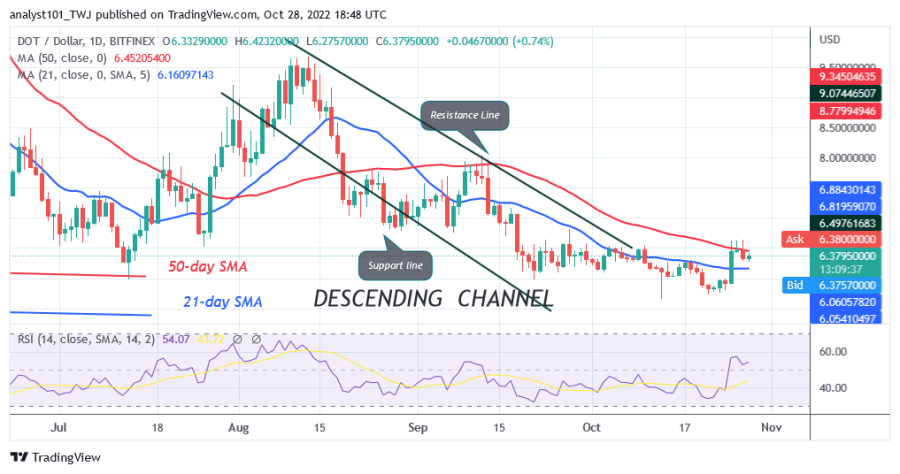
Polkadot (DOT) is in an upward correction as it breaks above the moving average lines. The cryptocurrency value rose above the moving average lines, but got stuck at the 50-day line SMA. The altcoin has been fluctuating between the moving average lines since October 25.
When the moving average lines cross, Polkadot will show a trend. For example, if the bears break below the 21-day SMA line, the DOT price would retest the previous low at $5.73 and $5.65. If the buyers keep the price above the 50-day line SMA, the altcoin will rise and regain the previous highs of $8 and $9.64.
Polkadot indicator analysis
Polkadot is recovering as it is at level 54 of the Relative Strength Index. With the rise to the previous highs, the altcoin is in the bullish trend zone. As the price bars are between the moving average lines, the altcoin will be forced to move in a range. The downward pointing moving average lines indicate a decline.

Technical indicators:
Major Resistance Levels - $10 and $12
Major Support Levels - $6 and $4
What is the next direction for Polkadot?
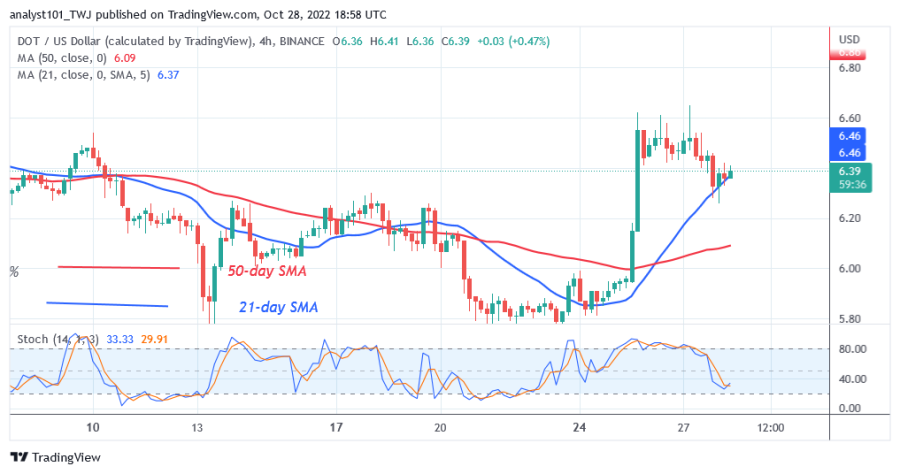
Since October 25, the altcoin has been struggling to break through resistance at $6.60. On the 4-hour chart, the price of DOT has declined after three unsuccessful attempts to break the recent high. There are bullish candlesticks above the 21-day line SMA, indicating a possible upward movement of the cryptocurrency.

Disclaimer. This analysis and forecast are the personal opinions of the author and are not a recommendation to buy or sell cryptocurrency and should not be viewed as an endorsement by CoinIdol. Readers should do their research before investing in funds.
Price
Coin expert
News
News
Price

(0 comments)