Polkadot Retraces from Recent High, May Slide to $49 Low
Updated: Nov 06, 2021 at 11:11

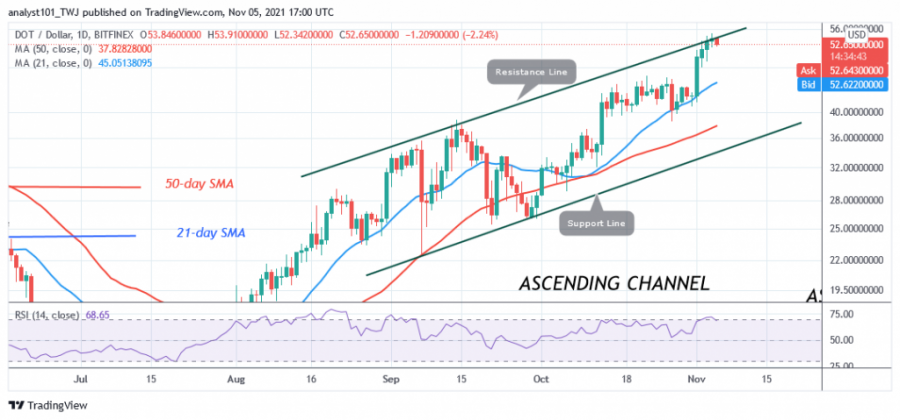
Today, the price of Polkadot (DOT) is in slight resistance after rising to a high of $54. The cryptocurrency rallied and reached an overbought region. The recovery became necessary as the altcoin was held below the $46 resistance for two weeks.
The breakout takes the altcoin to the next resistance. Further upside is possible if the altcoin falls back to support above the 21-day line SMA. The current uptrend is hampered by the cryptocurrency's overbought condition. DOT/USD is likely to reach the high of $58 if the bulls break the high of $54.
Polkadot indicator analysis
The cryptocurrency has fallen to the value 68 of the Relative Strength Index of the period 14. The DOT price has already reached the value 71 of the RSI of the period 14. Sellers have appeared, pushing the price down. The altcoin is still trading in the bullish trend zone and above the centre line 50. The moving averages are sloping upwards, indicating an uptrend. The cryptocurrency is below the 80% area of the daily stochastic. The market is in a bearish momentum.

Technical indicators:
Major Resistance Levels - $52 and $56
Major Support Levels - $28 and $24
What is the next direction for Polkadot?
Polkadot is in an uptrend. The current uptrend is moving below the $54 resistance zone, and the uptrend is likely to continue. Meanwhile, the uptrend from November 1 has a candlestick that tested the 61.8% Fibonacci retracement level. The retracement suggests that the price of DOT will rise to the 1.618 Fibonacci extension level, or $57.45.
![DOTUSD(4_Hour_Chart]_NOV._5.png DOTUSD(4_Hour_Chart]_NOV._5.png](/upload/medialibrary/f53/f53faecce5e63e6b6ccd47684bc4feb1.png)
Disclaimer. This analysis and forecast are the personal opinions of the author and are not a recommendation to buy or sell cryptocurrency and should not be viewed as an endorsement by CoinIdol. Readers should do their research before investing funds.
News
Price
News
Price
Price

(0 comments)