Polkadot Reaches Bearish Exhaustion as It May Decline to $4.81 Low

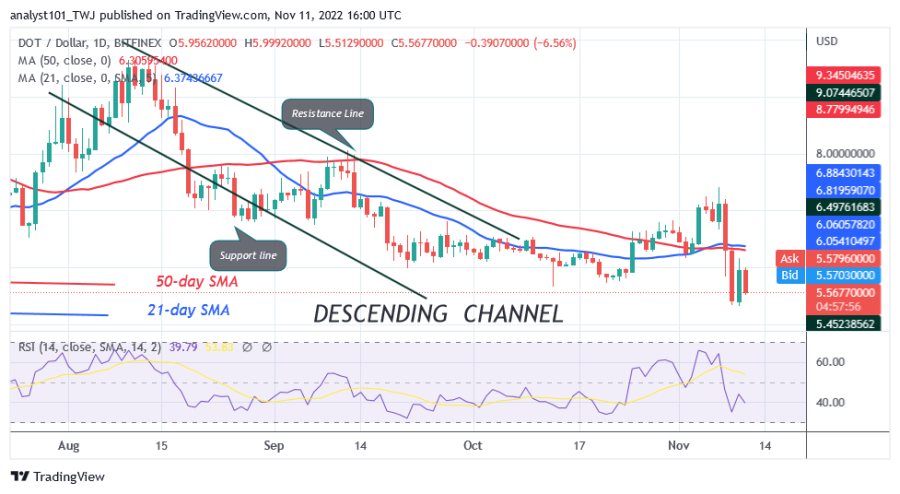
Polkadot (DOT) is in a downtrend as it falls below the moving average lines. The cryptocurrency's price dropped to a low of $5.34 before it started to fluctuate back above the existing support.
The price of DOT is currently trading below the moving average lines. In the previous price movement, DOT was trading above the moving average lines.
However, buyers failed to overcome the barrier at $7.10. Before the decline, they were rejected twice at the resistance of $7.10. On the downside, the altcoin has fallen below its previous low of $5.65.
DOT is now fluctuating between $5.30 and $6.40. If the current support is broken, the downtrend will resume. If the price breaks above the moving average lines or the $6.40 resistance level, Polkadot will resume its uptrend.
Polkadot indicator analysis
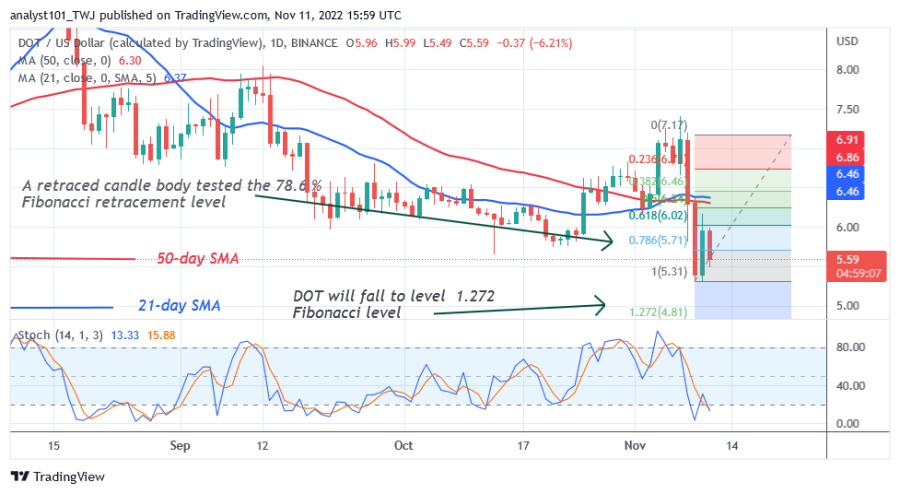
The price of DOT is at the level 40 of the Relative Strength Index for the period 14. The altcoin is in a downtrend area and could fall further. The price of the cryptocurrency may fall when the price bars are below the moving average lines. The slope of the moving average lines indicates deterioration. The daily stochastic of the altcoin is below the level of 20, which indicates that Polkadot has experienced its bearish maximum.

Technical indicators:
Major Resistance Levels - $10 and $12
Major Support Levels - $6 and $4
What is the next direction for Polkadot?
Polkadot has reached bearish exhaustion and is currently in a downtrend. The price of DOT turned up during the downturn on November 9 and a candlestick tested the 78.6% Fibonacci retracement level. After the correction, the price of DOT will fall to the Fibonacci level of $1.272 or $4.81.

Disclaimer. This analysis and forecast are the personal opinions of the author and are not a recommendation to buy or sell cryptocurrency and should not be viewed as an endorsement by CoinIdol. Readers should do their research before investing in funds.
Price
Price
Price
Price
News

(0 comments)