Polkadot Retraces From $35 High, Poises for a New Uptrend

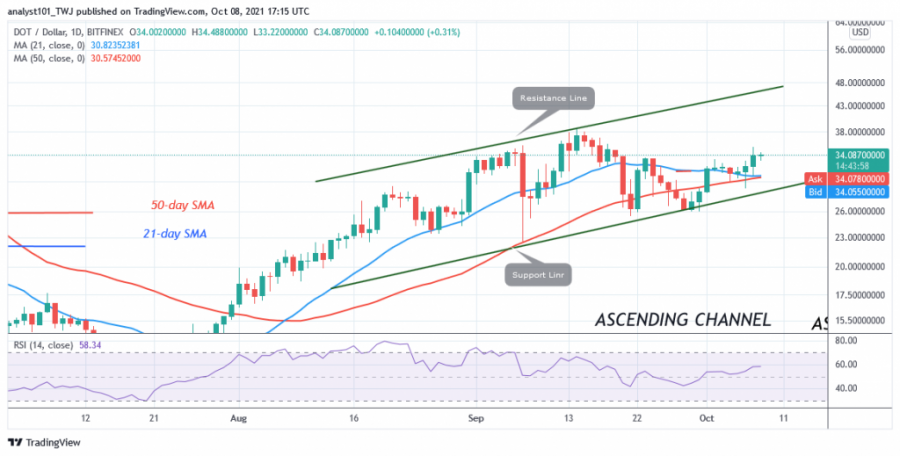
Since October 2, the price of Polkadot (DOT) has broken out above its moving averages as buyers push the altcoin to previous highs. Currently, buyers are meeting resistance at the $35 high.
The market is considered overbought at the recent high. Sellers are defending the recent high while pushing prices lower. The altcoin could retrace to the low of $32. In other words, the altcoin will fall and find support above the 21-day line SMA. Nevertheless, buyers will resume a new uptrend if the 21-day line SMA provides support. However, if the bears break below the 21-day line SMA, selling pressure will increase again as the altcoin falls into the downtrend zone.
Polkadot indicator analysis
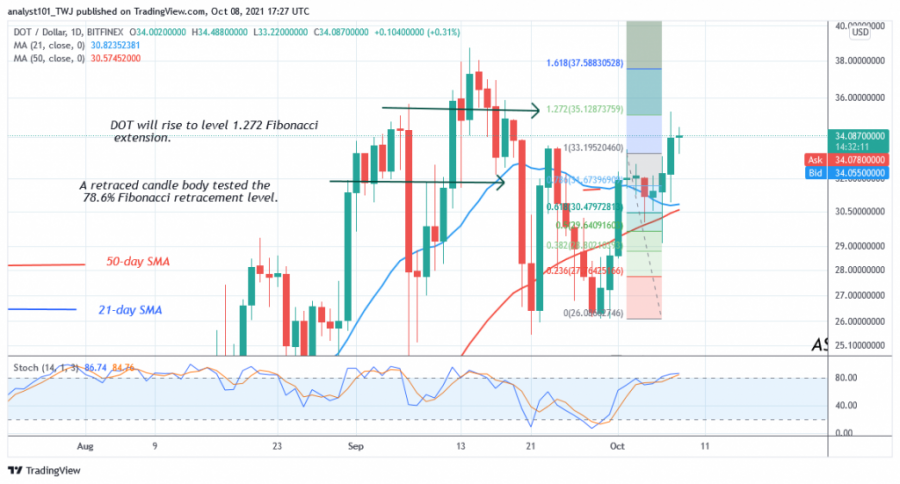
DOT price is at the 57 level of the Relative Strength Index of the period 14. The cryptocurrency value is now in the uptrend zone and is capable of rising. The uptrend will resume when the altcoin drops above the moving averages. Currently, the price of DOT is above the 80% range of the daily stochastic. This indicates that the market has reached the overbought zone. DOT will fall when sellers appear in the overbought area.

Technical indicators:
Major Resistance Levels - $48 and $52
Major Support Levels - $24 and $20
What is the next direction for Polkadot?
On the 4-hour chart, Polkadot is in a short uptrend. The price indicator suggests a possible rise and reversal in the altcoin. Meanwhile, the uptrend from October 2 has a candlestick testing the 78.6% Fibonacci retracement level. The retracement suggests that the price of DOT will rise but fall back to the 1.272 Fibonacci extension level, or $33.19.

Disclaimer. This analysis and forecast are the personal opinions of the author and are not a recommendation to buy or sell cryptocurrency and should not be viewed as an endorsement by CoinIdol. Readers should do their research before investing funds.
Price
Coin expert
News
News
Price

(0 comments)